Stock Recommendation System
| Language | Version | IDE |
| Python | 2.7 | PyCharm |
This is a simple Python project that offers stock investment recommendations based on Machine Learning predictions from last year's values of any market symbol and also based on Twitter sentiment analysis from retrieved tweets containing the symbol as text inside of it.
Installation
- Python >=2.7
- pandas >= 0.23.4
- numpy >= 1.15
- tweepy >= 3.6.0
- fix_yahoo_finance >= 0.0.22
- textblob >= 0.15.1
- scikit-learn >= 0.19.2
Requirements
Once you have installed the packages, you will need to create a file inside the project folder named constants.py that has to look like this:
consumer_key = ''
consumer_secret = ''
access_token = ''
access_token_secret = ''

num_of_tweets = int()
This file contains the API keys from Twitter, that you can get from Twitter Developer Platflorm applying for them using you own Twitter account, and the number of tweets you want to retrieve for the sentiment analysis.
Explanation
To check if the stock symbol introduced via prompt is valid (or if it exists) I check if it appears in a Company List CSV that contains every stock symbol available:
flag = False
df = pd.read_csv('companylist.csv', usecols=[0])

while flag is False:
    symbol = raw_input('Enter a stock symbol to retrieve data from: ').upper()
    for index in range(len(df)):
        if df['Symbol'][index] == symbol:
            flag = True
Now, the next step is to create the Pandas DataFrame of the introduced symbol stock market values from the last year from now. The information is retrieved from Yahoo! Finance using yahoo-finance-fix.
actual_date = dt.date.today()
past_date = actual_date - dt.timedelta(days=366)

actual_date = actual_date.strftime("%Y-%m-%d")
past_date = past_date.strftime("%Y-%m-%d")

data = yf.download("AAPL", start=past_date, end=actual_date)
df = pd.DataFrame(data=data)
Once the DataFrame is created, I start modelling it to use the prediction algorithms from scikit-learn, in this case I will use LinearRegression because it has a nice accuracy score overrall, but if you want you can use almost any of the regression algorithms for stock precition listed in sklearn.
Fist I set up the model for the forecast:
df = df[['Open', 'High', 'Low', 'Close', 'Volume']]
df['HighLoad'] = (df['High'] - df['Close']) / df['Close'] * 100.0
df['Change'] = (df['Close'] - df['Open']) / df['Open'] * 100.0

df = df[['Close', 'HighLoad', 'Change', 'Volume']]

forecast_col = 'Close'
forecast_out = int(math.ceil(0.01*len(df)))
df['Label'] = df[[forecast_col]].shift(-forecast_out)
Then I apply a preprocessing to the X values, that are the original values of the Close ones, but without the forecast out values, that are shifted up to the 10% of the whole dataset. So on I apply the cross-validation algorithm to establish the X and y values for trainning (20%) and testing.
X = np.array(df.drop(['Label'], axis=1))
X = preprocessing.scale(X)
X_forecast = X[-forecast_out:]
X = X[:-forecast_out]

df.dropna(inplace=True)
y = np.array(df['Label'])

X_train, X_test, y_train, y_test = train_test_split(X, y, test_size=0.2)
Finally I apply the LinearRegression algorithm to the data set and then I plot it to see the representation of the forecast made.
clf = LinearRegression(n_jobs=-1)
clf.fit(X_train, y_train)
accuracy = clf.score(X_test, y_test)
forecast = clf.predict(X_forecast)
df['Prediction'] = np.nan
last_date = df.iloc[-1].name
last_date = dt.datetime.strptime(str(last_date), "%Y-%m-%d %H:%M:%S")
for pred in forecast:
last_date += dt.timedelta(days=1)
df.loc[last_date.strftime("%Y-%m-%d")] = [np.nan for _ in range(len(df.columns) - 1)] + [pred]
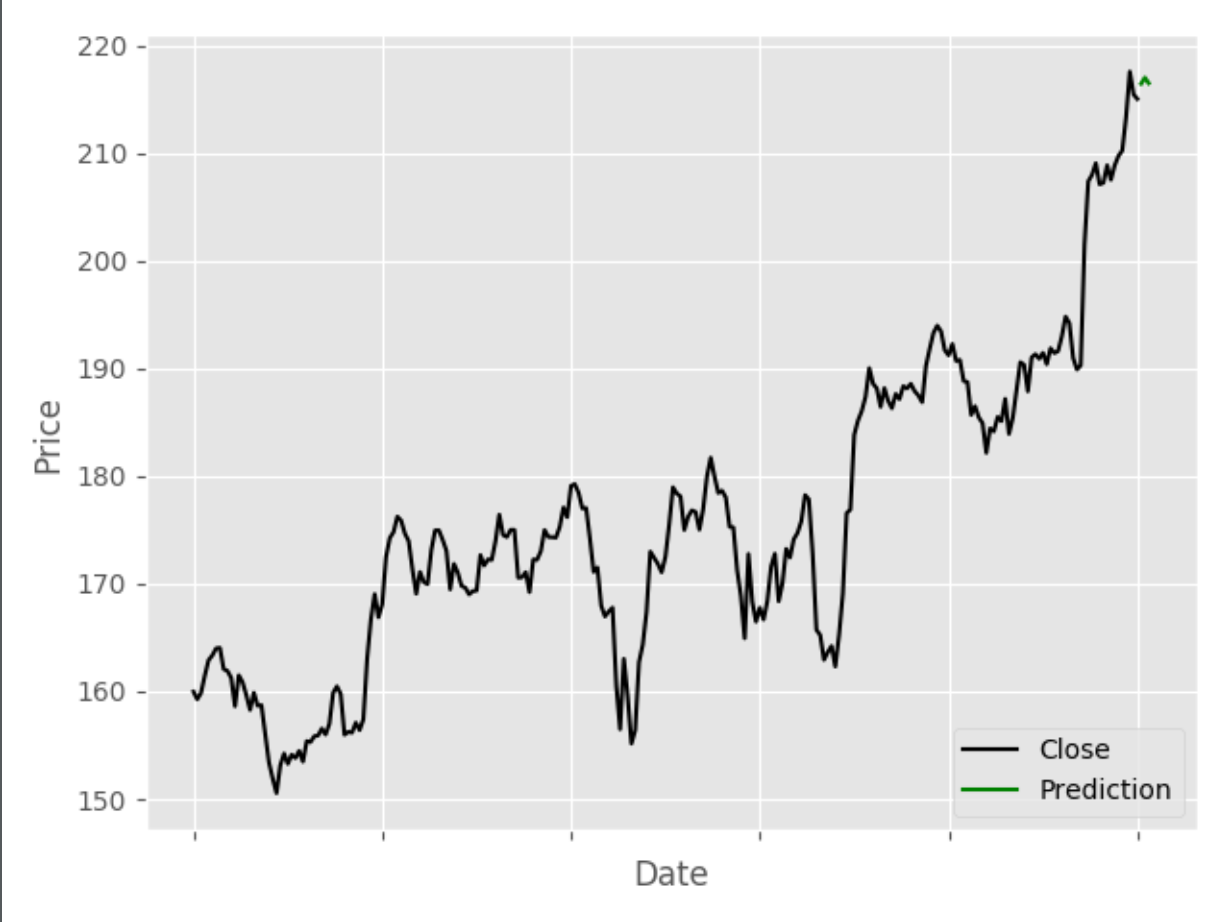
df['Close'].plot(color='black')
df['Prediction'].plot(color='green')
plt.legend(loc=4)
plt.xlabel('Date')
plt.ylabel('Price')
plt.show()For example, for Apple Inc. (AAPL) the prediction plot looks like this:
Once the stock prediction has finished, the Twitter sentiment analysis starts and it retrieves a list of the last 100 tweets posted in english containing the symbol introduced and they are later stored in a list of Tweet class, defined in Tweet.py with the tweet's text and polarity from TextBlob.
auth = tweepy.OAuthHandler(ct.consumer_key, ct.consumer_secret)
auth.set_access_token(ct.access_token, ct.access_token_secret)
user = tweepy.API(auth)

tweets = tweepy.Cursor(user.search, q=str(symbol), tweet_mode='extended', lang='en').items(ct.num_of_tweets)

tweet_list = []
global_polarity = 0
for tweet in tweets:
    tw = tweet.full_text
    blob = TextBlob(tw)
    polarity = 0
    for sentence in blob.sentences:
        polarity += sentence.sentiment.polarity
        global_polarity += sentence.sentiment.polarity
    tweet_list.append(Tweet(tw, polarity))

global_polarity = global_polarity / len(tweet_list)
Now, to make the recommendation I check if the prediction was favorable compared to the last non-predicted value and if it is, then the global polarity is checked and if it is positive (>0.0 according to TextBlob values), the system recommendation is to invest in that symbol, if not, the recommendation is not to invest.
if df.iloc[-forecast_out-1]['Close'] < df.iloc[-1]['Prediction']:
 if global_polarity > 0:
     print("According to the predictions and twitter sentiment analysis -> Investing in %s is a GREAT idea!" % str(symbol))
 elif global_polarity < 0:
     print("According to the predictions and twitter sentiment analysis -> Investing in %s is a BAD idea!" % str(symbol))
else:
 print("According to the predictions and twitter sentiment analysis -> Investing in %s is a BAD idea!" % str(symbol))
Author & License
Head of Development
twitter-stock-recommendation is distributed under the MIT License. See the LICENSE.txt file in the release for details.