

Lets-Plot is a multiplatform plotting library based on the Grammar of Graphics.
The library' design is heavily influenced by Leland Wilkinson work The Grammar of Graphics describing the deep features that underlie all statistical graphics.
This grammar [...] is made up of a set of independent components that can be composed in many different ways. This makes [it] very powerful because you are not limited to a set of pre-specified graphics, but you can create new graphics that are precisely tailored for your problem.
- Hadley Wickham, "ggplot2: Elegant Graphics for Data Analysis"
A bridge between R (ggplot2) and Python data visualization.
To learn more see the documentation site at lets-plot.org.

Create plots in Kotlin Notebook,
Datalore, Jupyter with Kotlin Kernel
or any other notebook that supports Kotlin Kernel.
To learn more see the Lets-Plot Kotlin API project at GitHub.
Embed Lets-Plot charts in Compose Multiplatform applications.
To learn more see the Lets-Plot Skia Frontend project at GitHub.
Embed Lets-Plot charts in JVM (Swing, JavaFX) and Kotlin/JS applications.
To learn more see the Lets-Plot Kotlin API project at GitHub.


Scientific mode in PyCharm and in IntelliJ IDEA provides support for interactive scientific computing and data visualization.
Lets-Plot in SciView plugin adds support for interactive plotting to IntelliJ-based IDEs with the Scientific mode enabled.
Note: The Scientific mode is NOT available in communinty editions of JetBrains IDEs.
Also read:
-
See: example notebook.
-
Do NOT(!) use
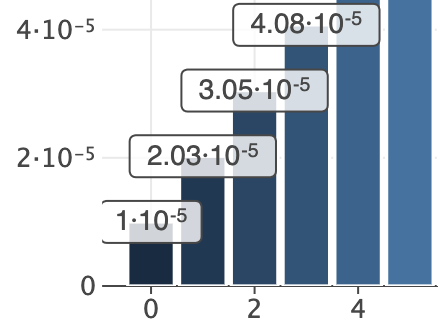
exponent_format='pow'if you are planning to export plot to a raster format (PNG,PDF).The
CairoSVGlibrary (which is under the hood of ourggsave()function) does not handletspanelement properly end breaks superscript notation when transforming SVG to PNG/PDF.More details: Kozea/CairoSVG#317
See: example notebook.
-
Convenience methods:
to_svg(),to_html(),to_png(),to_pdf()See: example notebook.
-
See: example notebook.
-
See: example notebook.
-
See: example notebook.
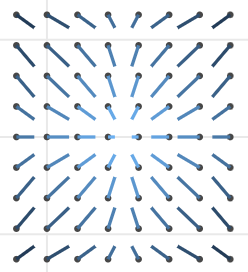
See advanced example: Spatial prediction of soil pollutants with multi-output Gaussian processes. Credits: Essi Parent (@essicolo). -
scale_x_log2(),scale_y_log2()- New variables computed by
'count'and'count2d'statistics:'..sumprop..','..sumpct..'. See: example notebook. - Support using dictionaries for breaks/labels/values customization in
scale_xxx()functions. See: example notebook. - The
lablimparameter inscale_xxx()functions. See: example notebook. label_textparameter intheme()for annotation text settings. See: example notebook.- NumberFormat: new flag
~to trim trailing zeros.
See CHANGELOG.md for other changes and fixes.
This project and the corresponding community are governed by the JetBrains Open Source and Community Code of Conduct. Please make sure you read it.
Code and documentation released under the MIT license. Copyright © 2019-2024, JetBrains s.r.o.


