Create artistic visualisations with your exercise data (Python version).
This is a port of the R strava package to Python.
Install via pip:
python3 -m pip install stravavisFor development:
git clone https://github.com/marcusvolz/strava_py
cd strava_py
pip install -e .
Then run from the terminal:
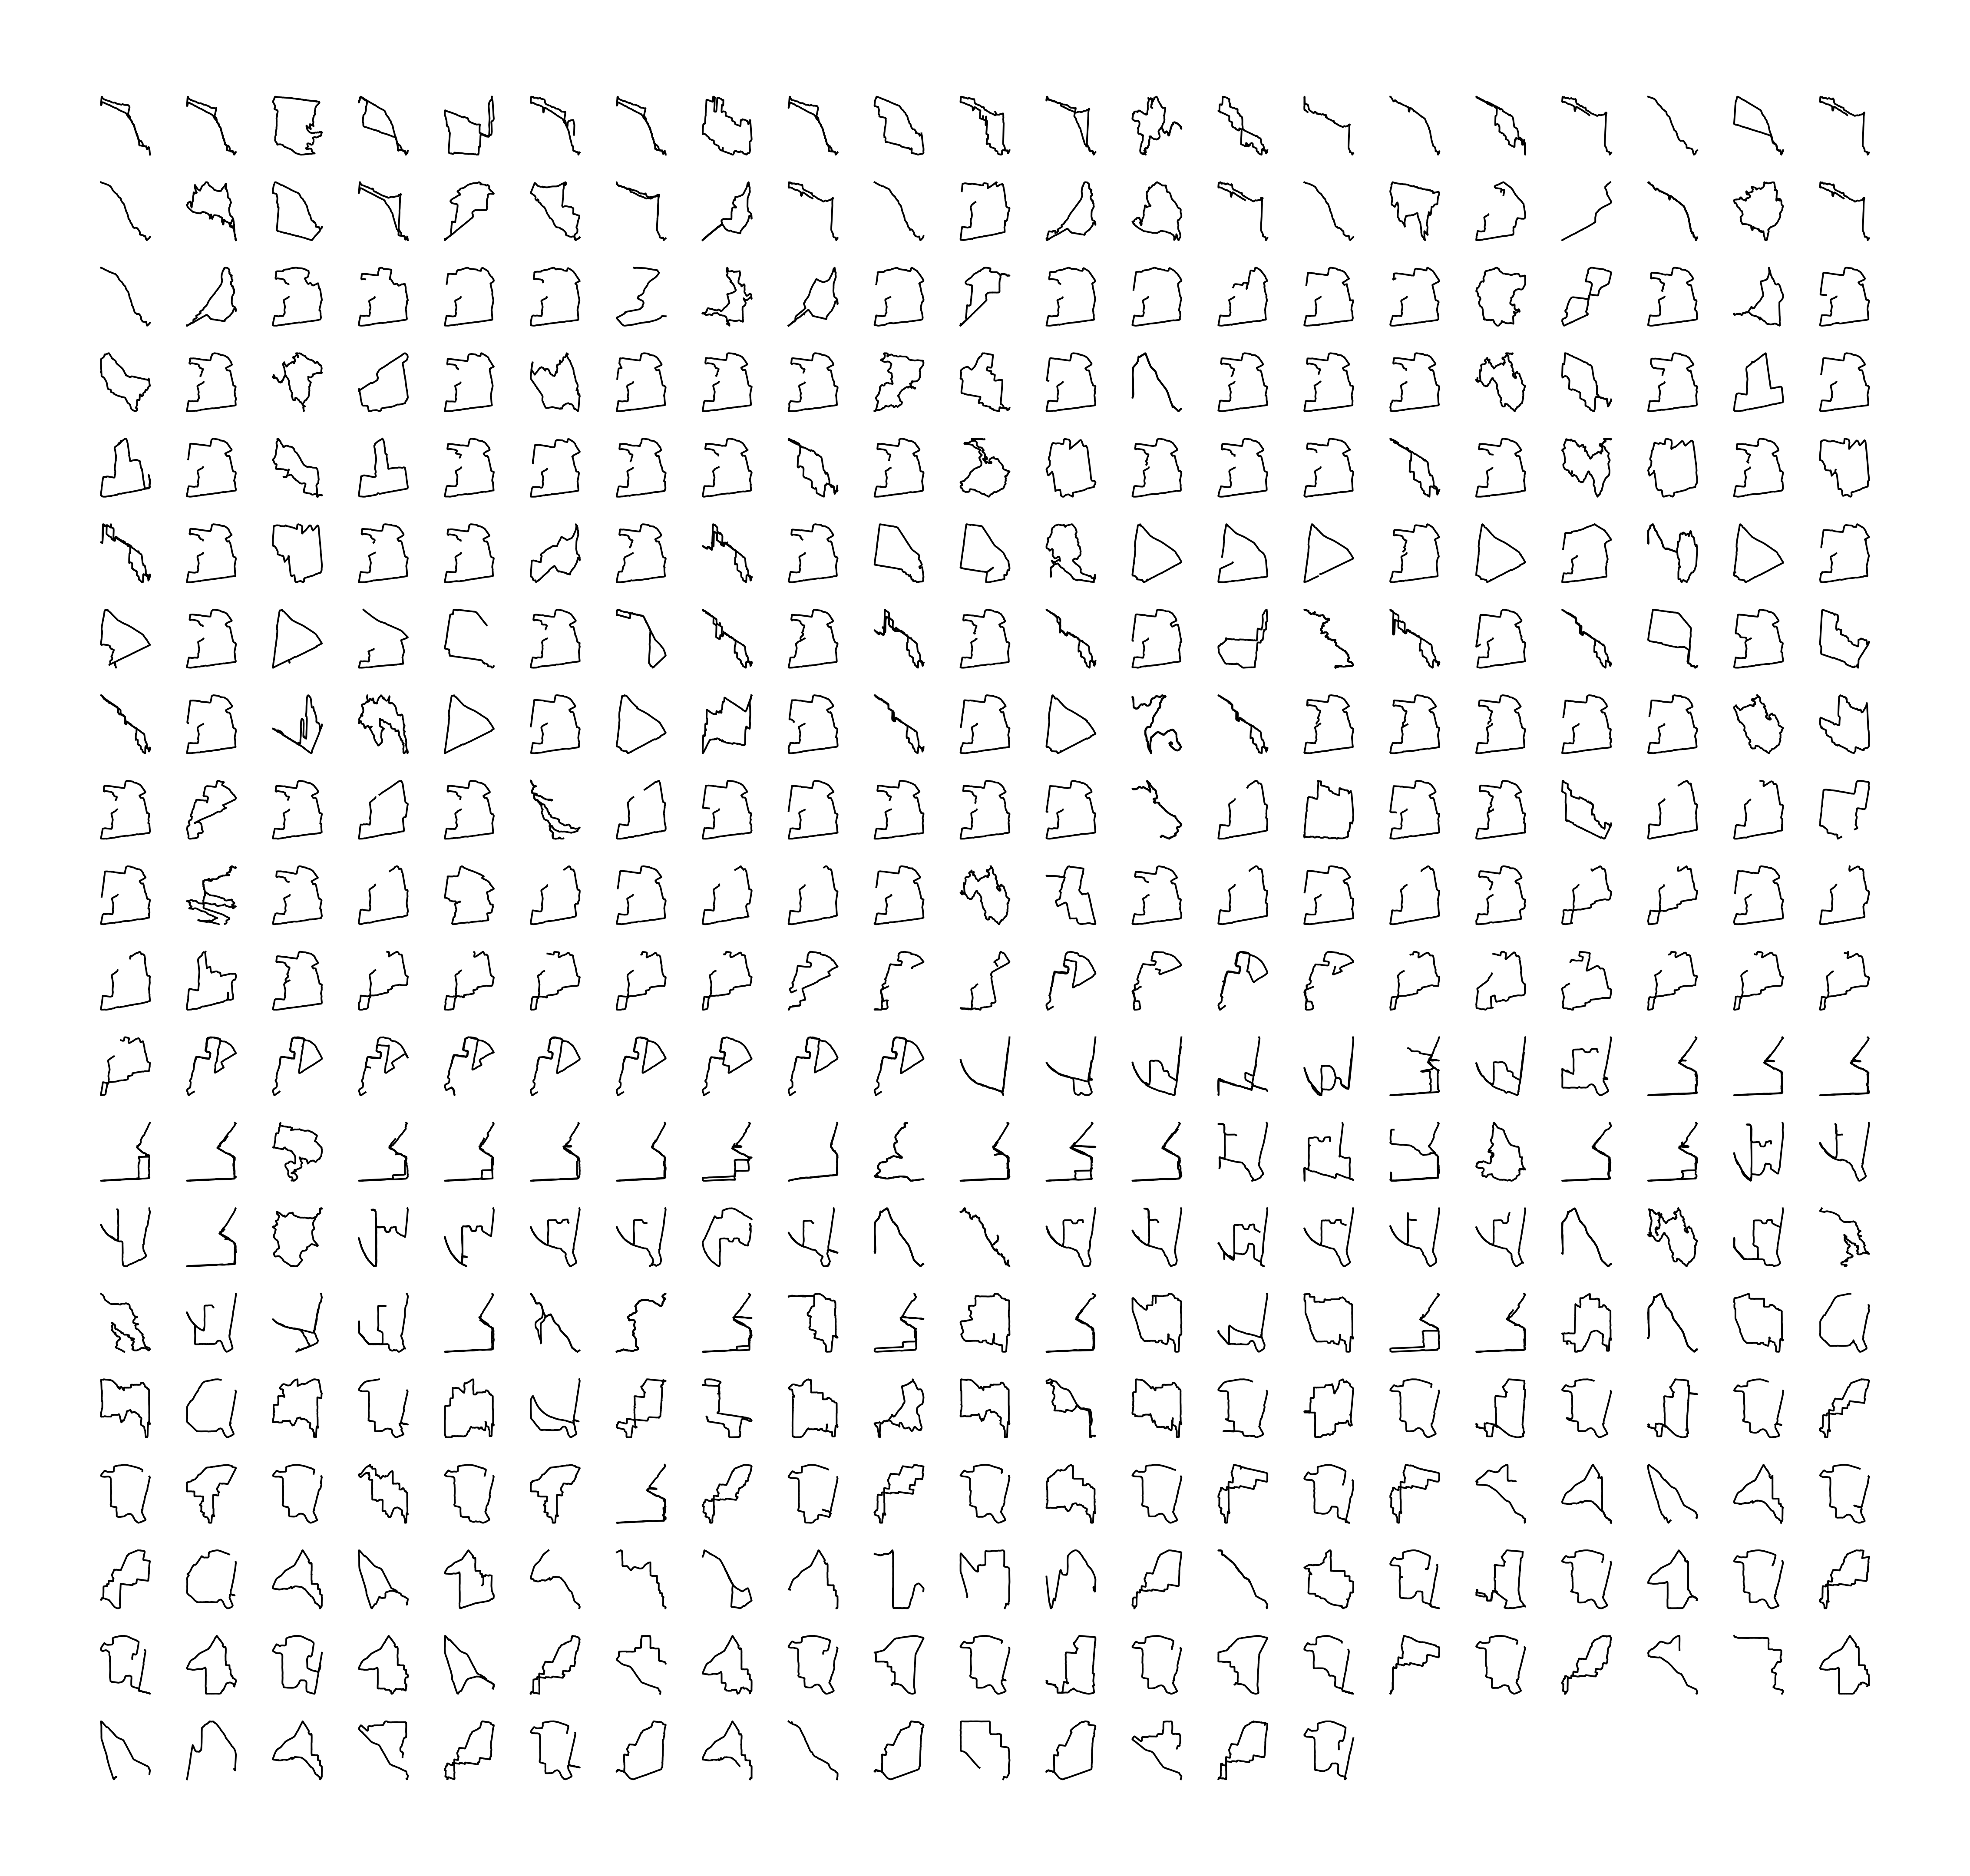
stravavis --helpA plot of activities as small multiples. The concept behind this plot was originally inspired by Sisu.
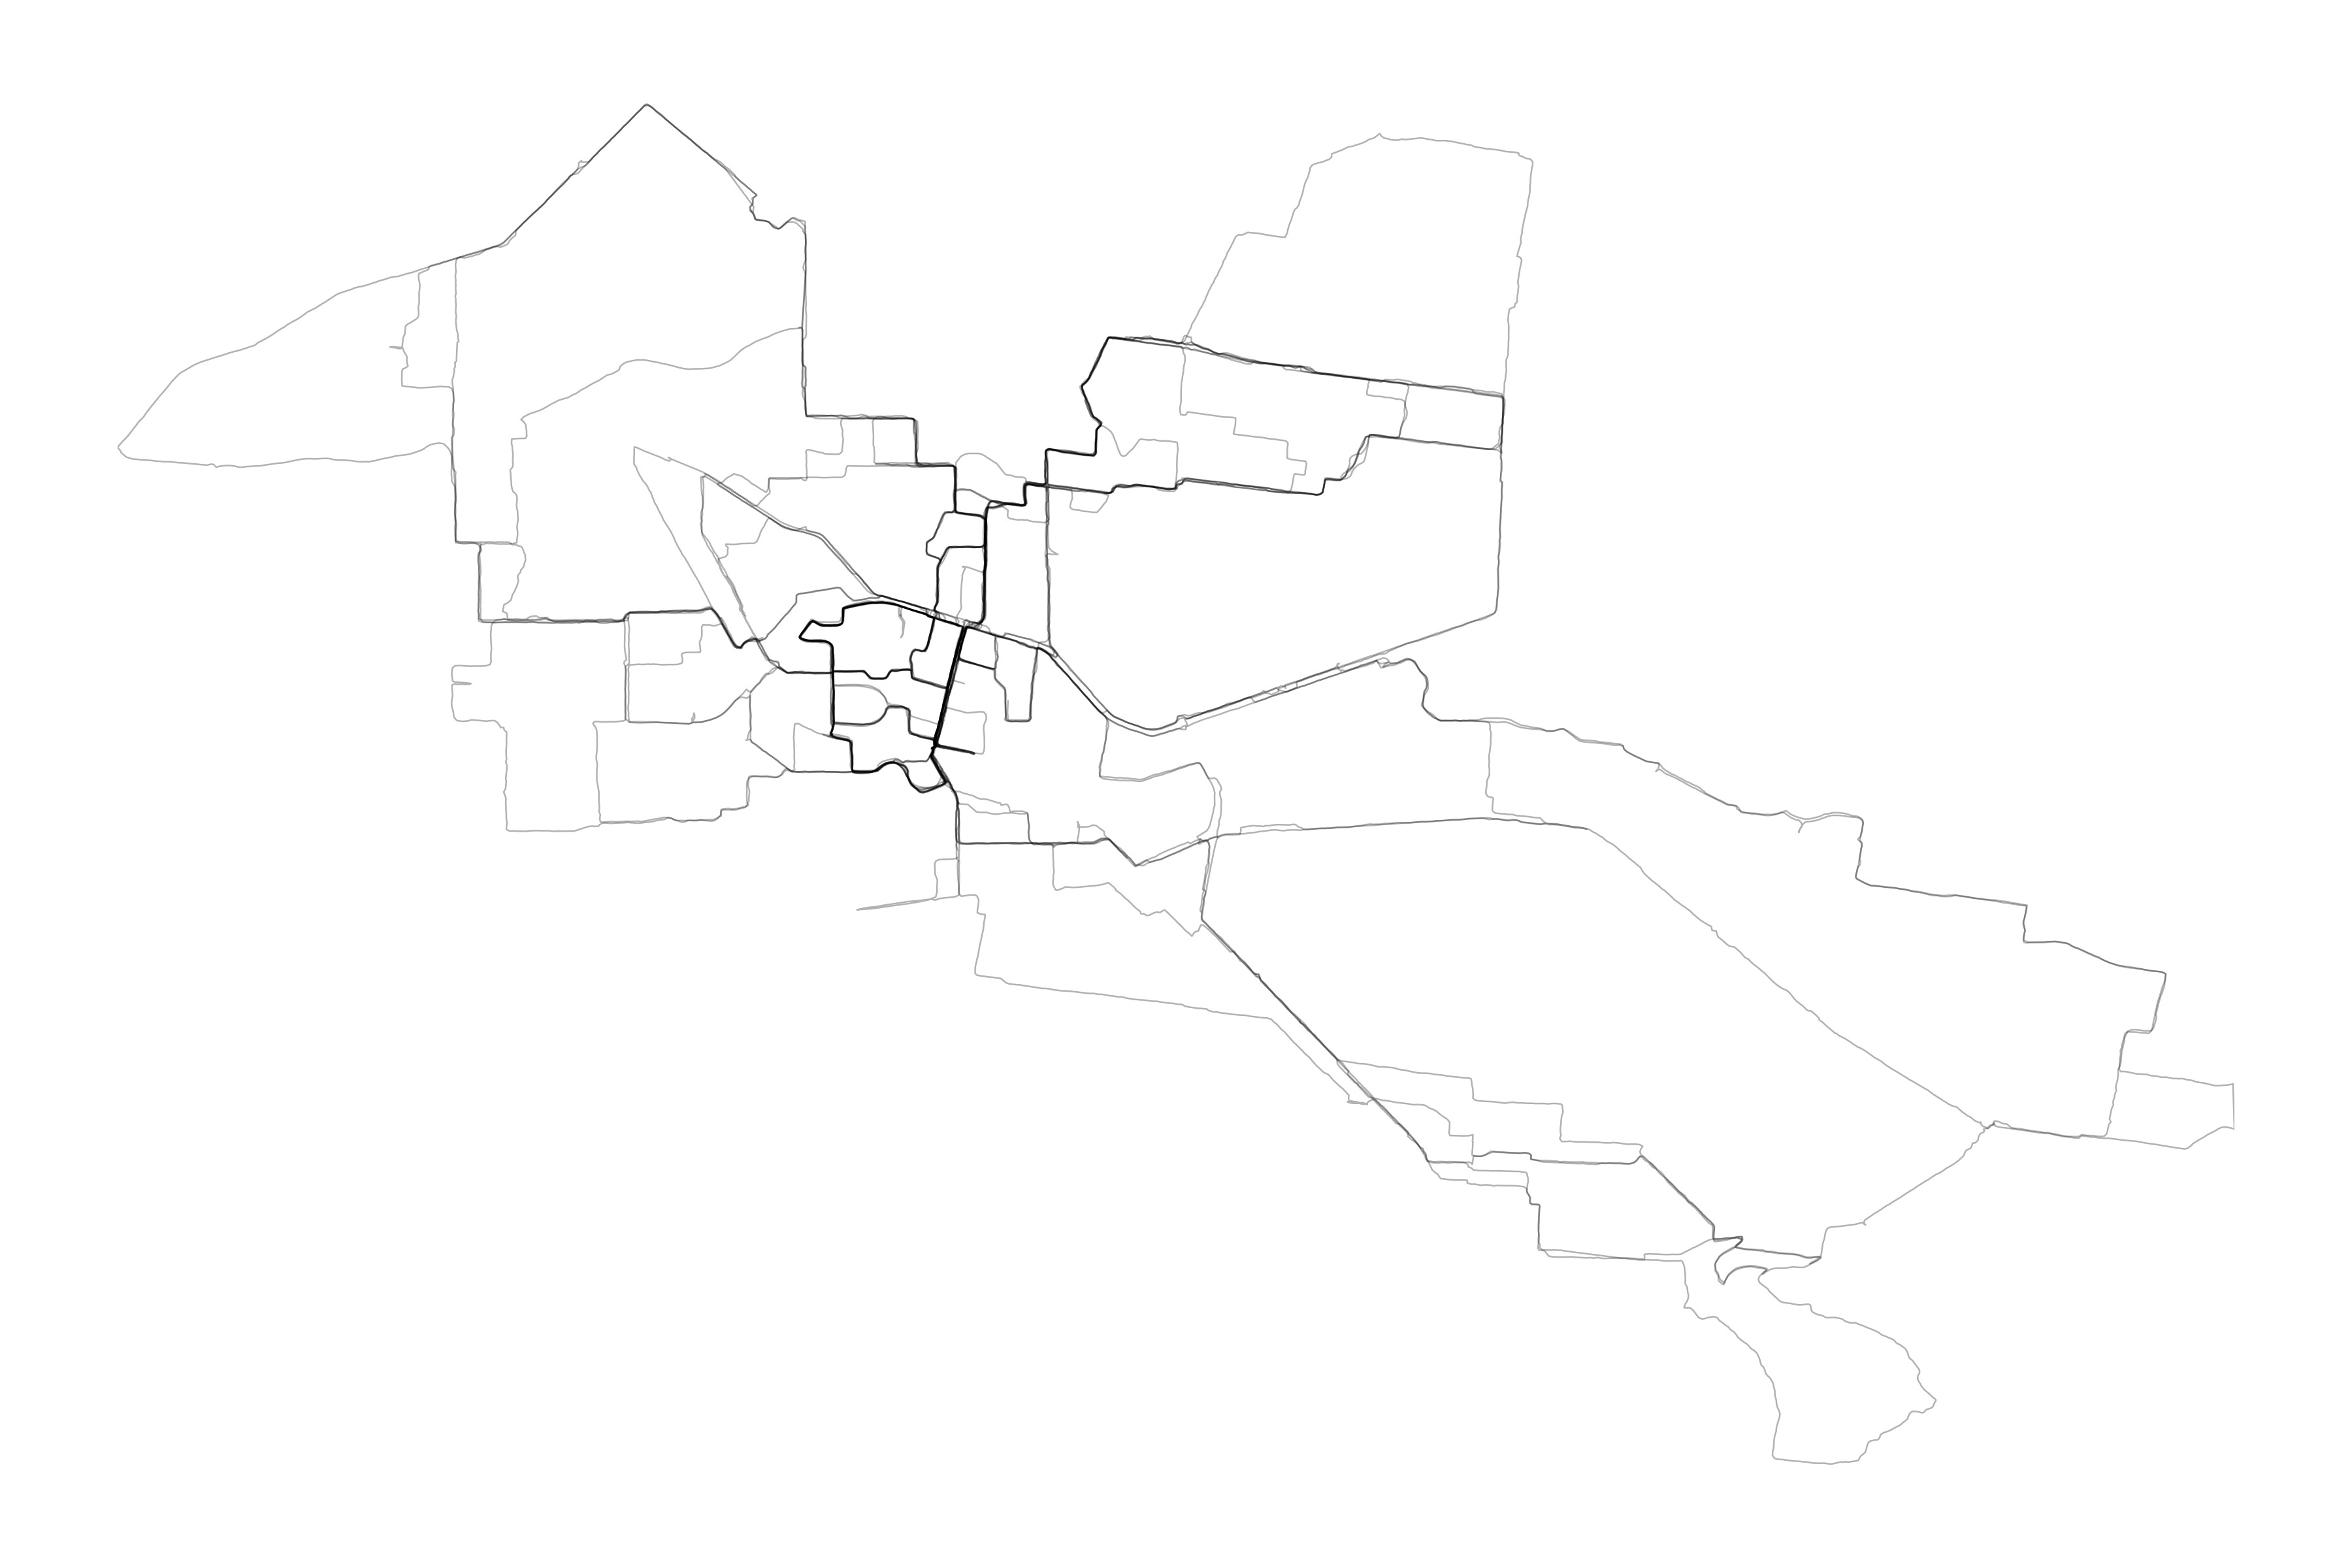
A map of activities viewed in plan.
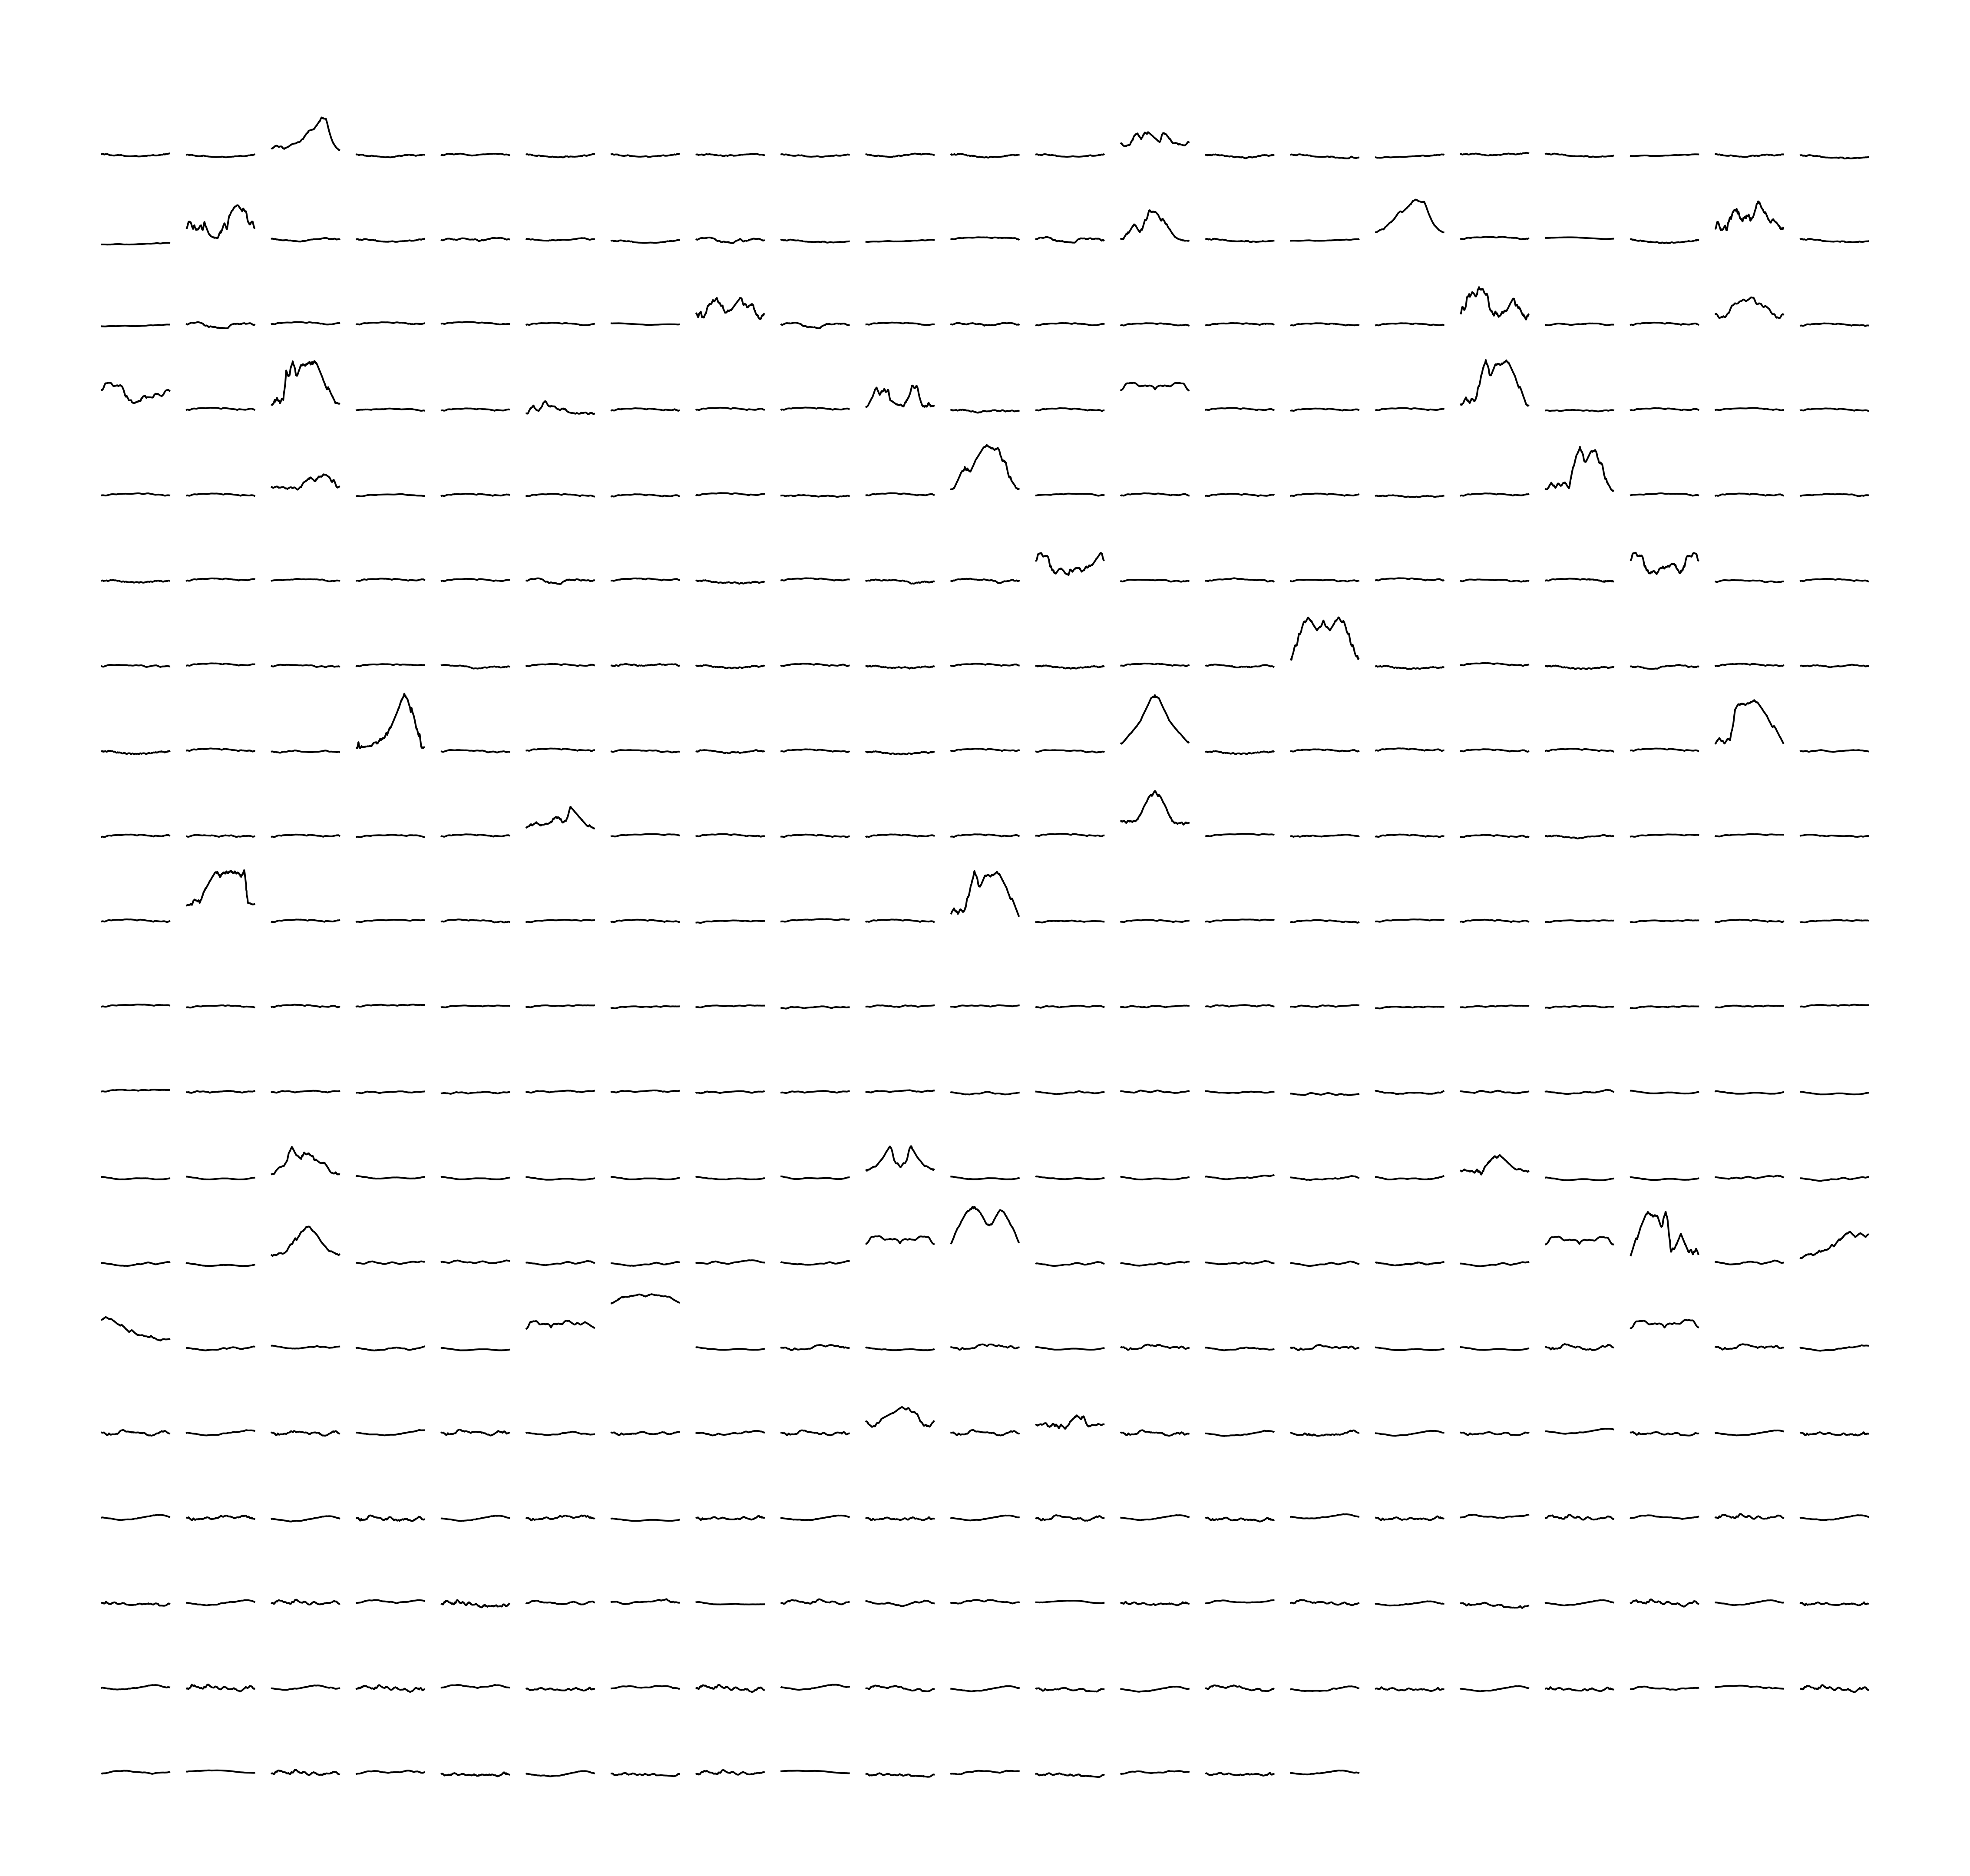
A plot of activity elevation profiles as small multiples.
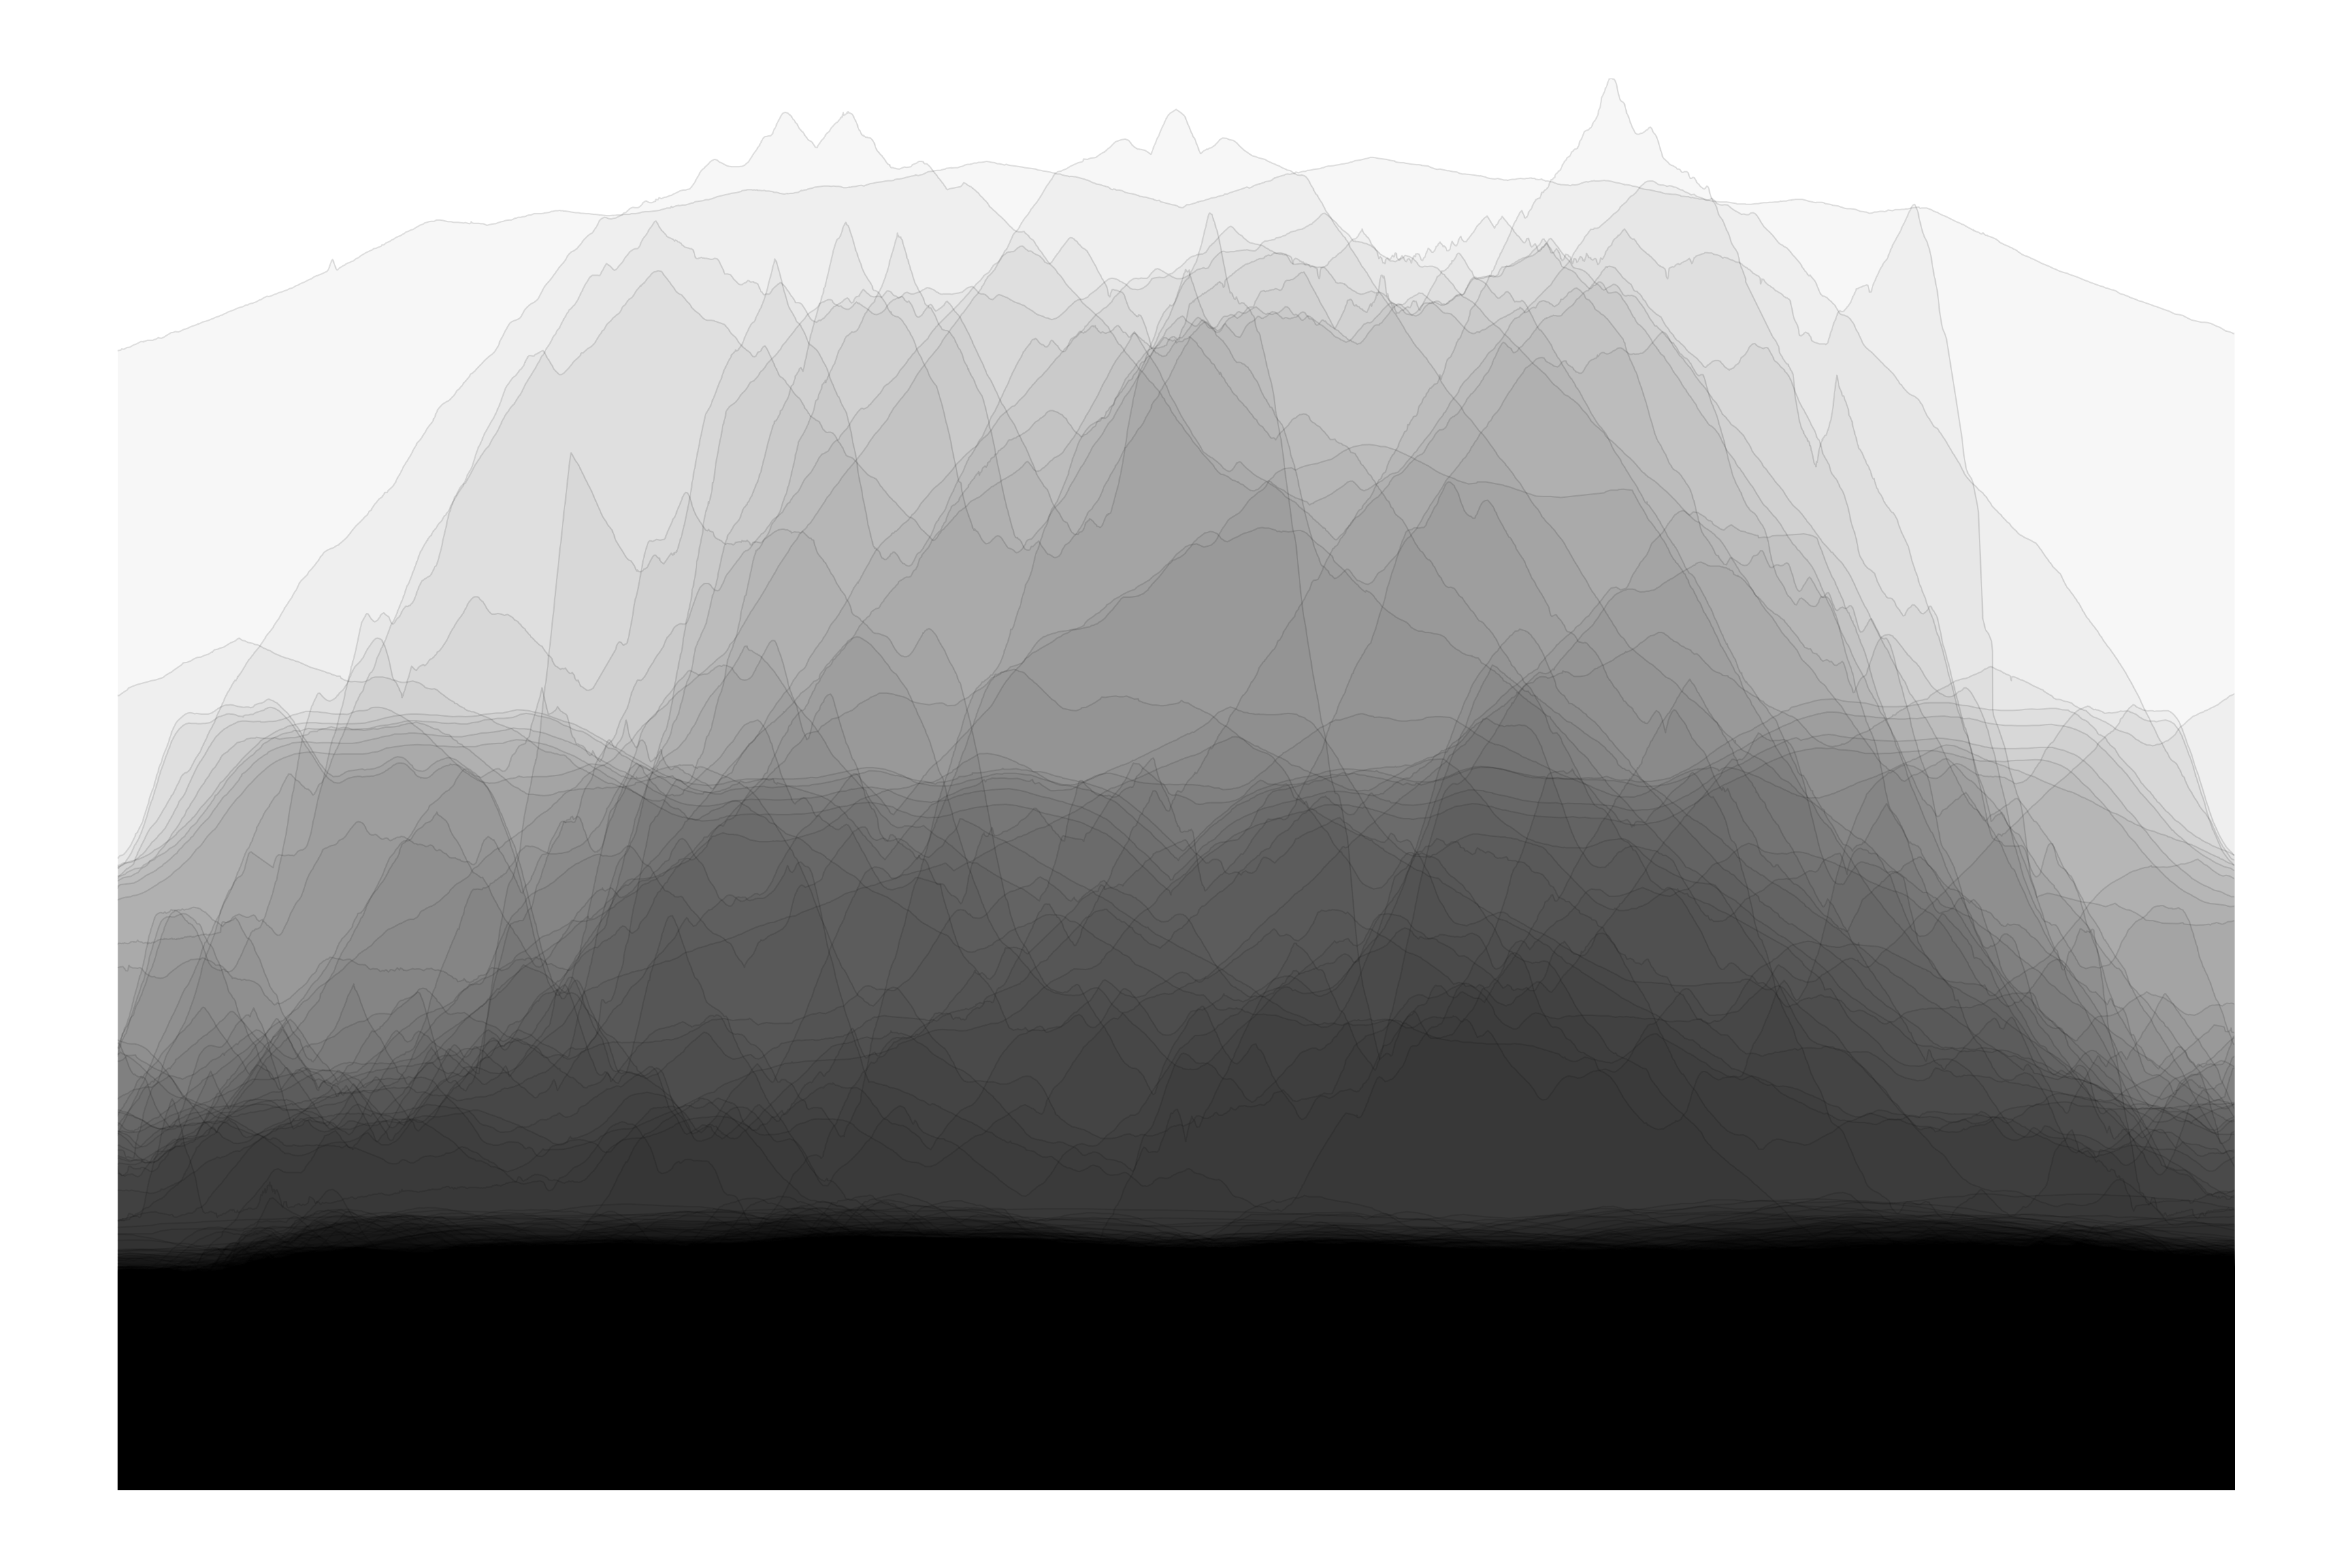
Elevation profiles superimposed.
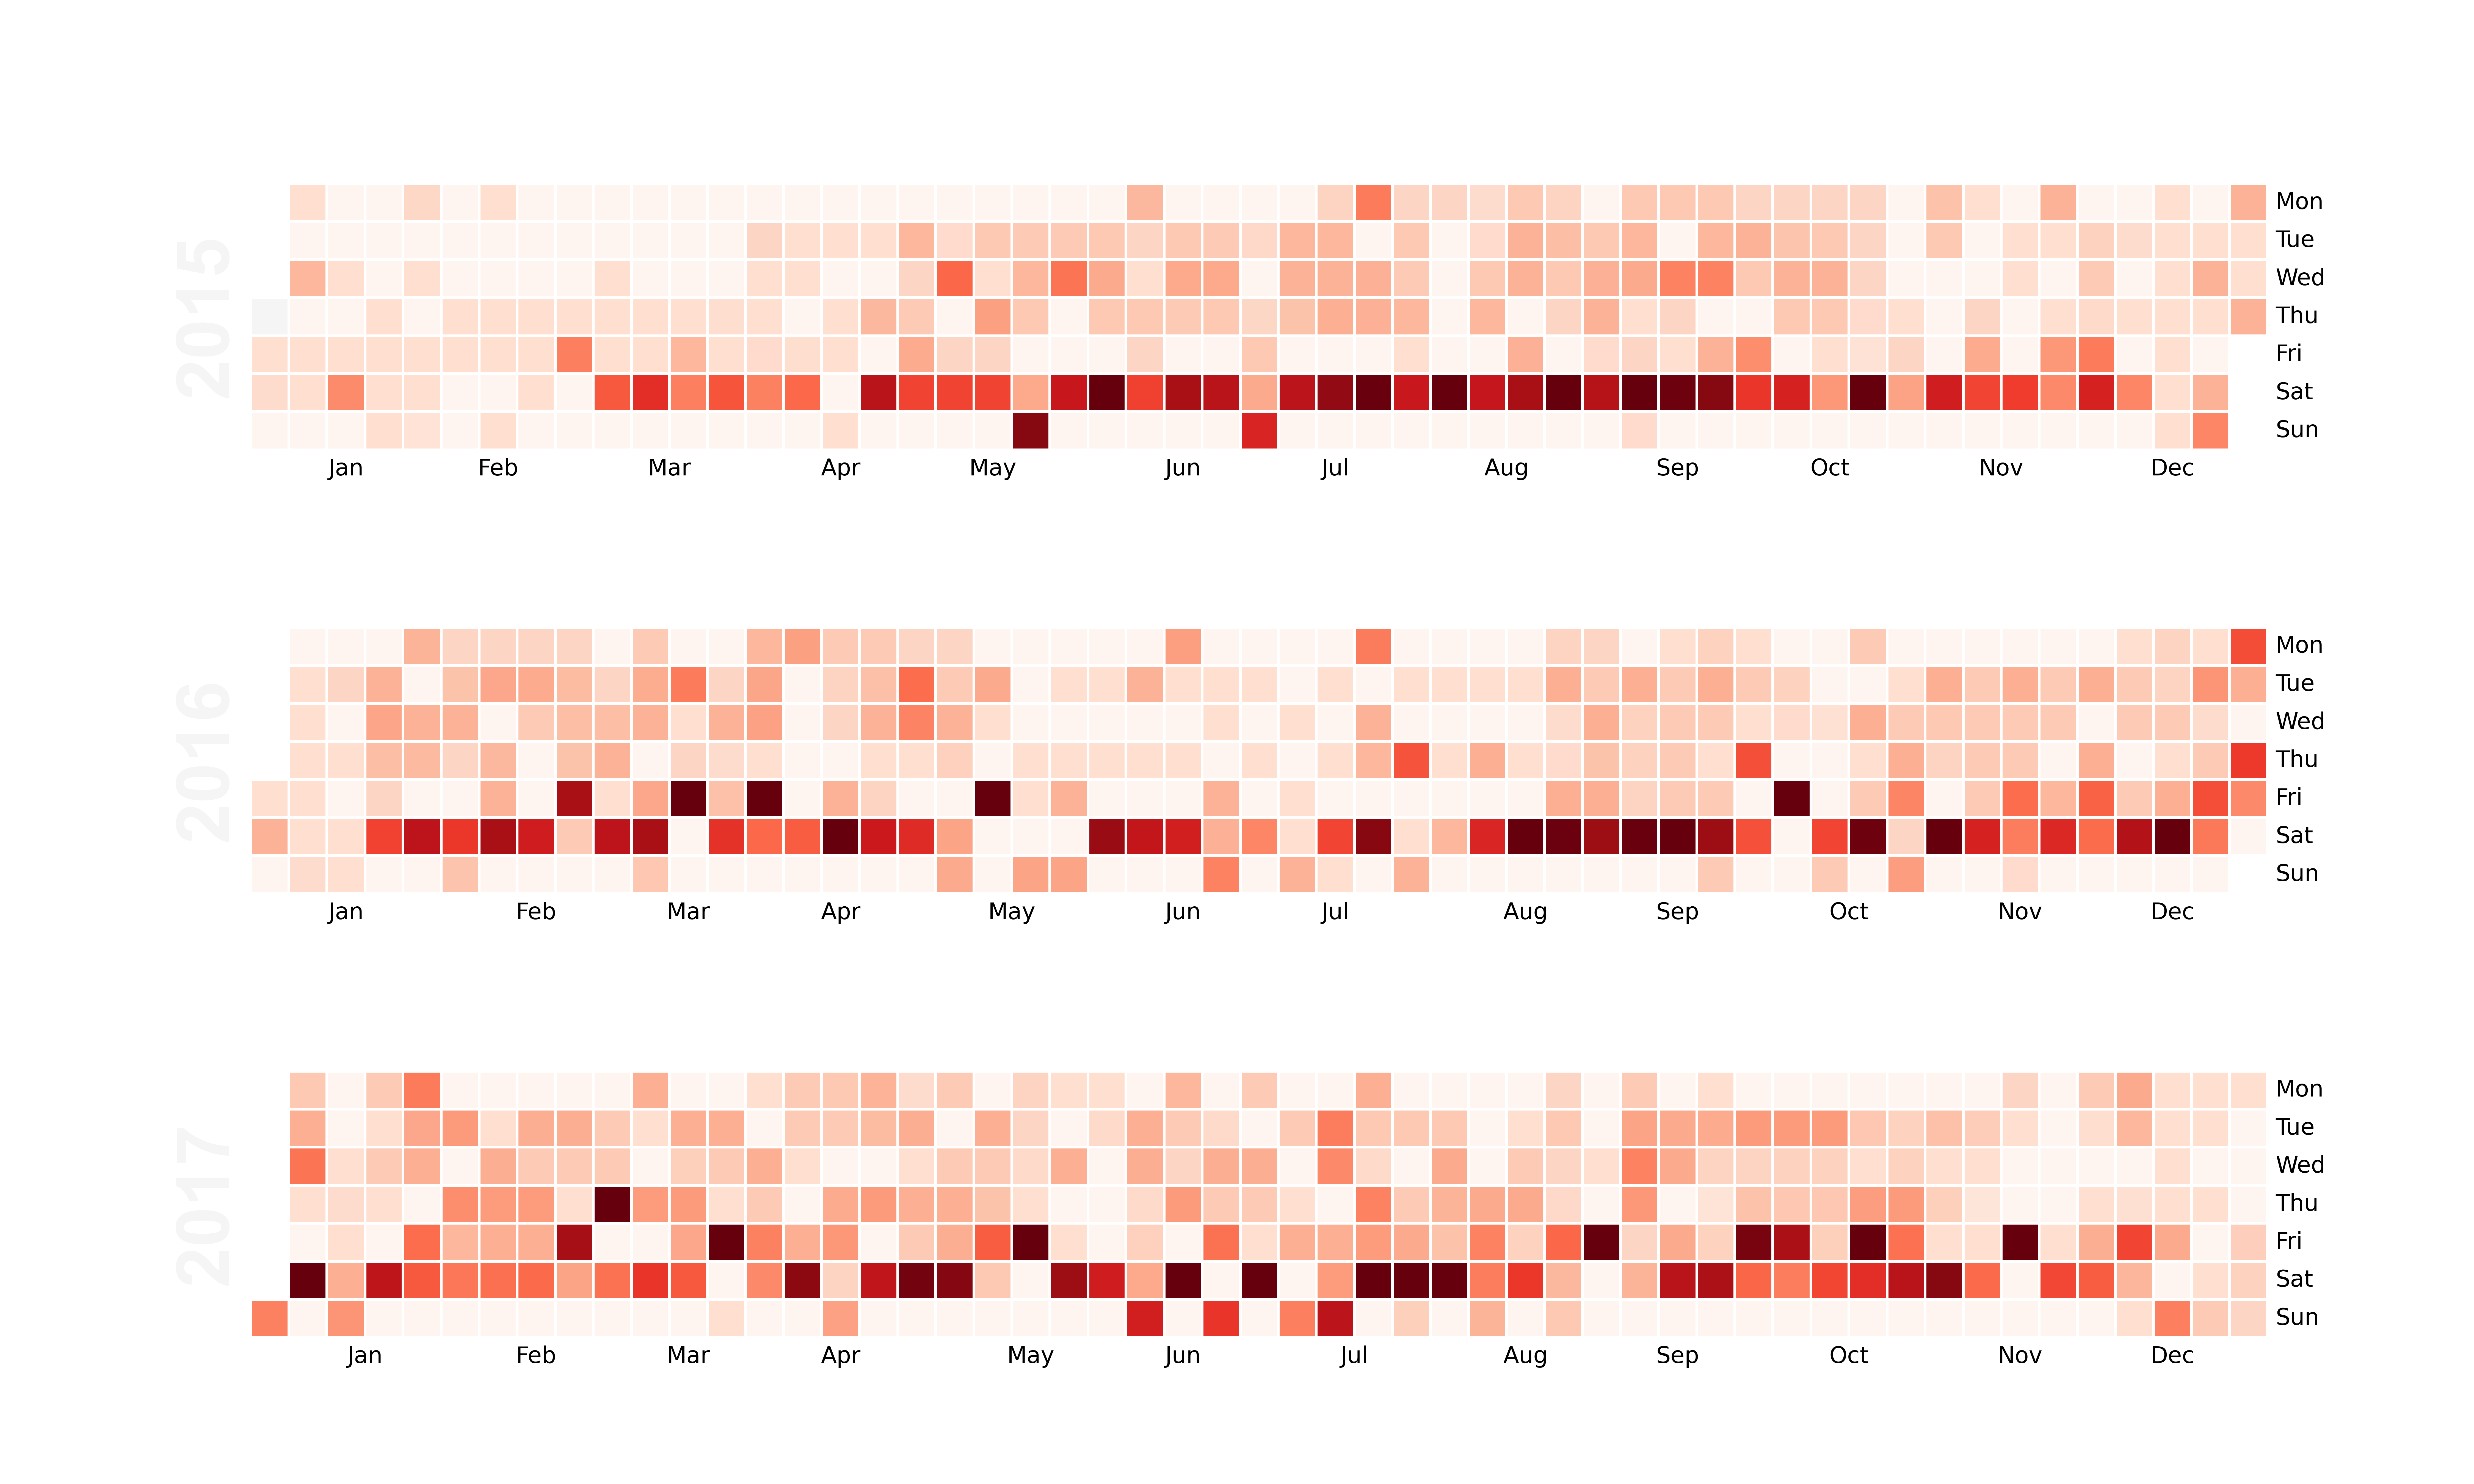
Calendar heatmap showing daily activity distance, using the calmap package. Requires "activities.csv" from the bulk Strava export.
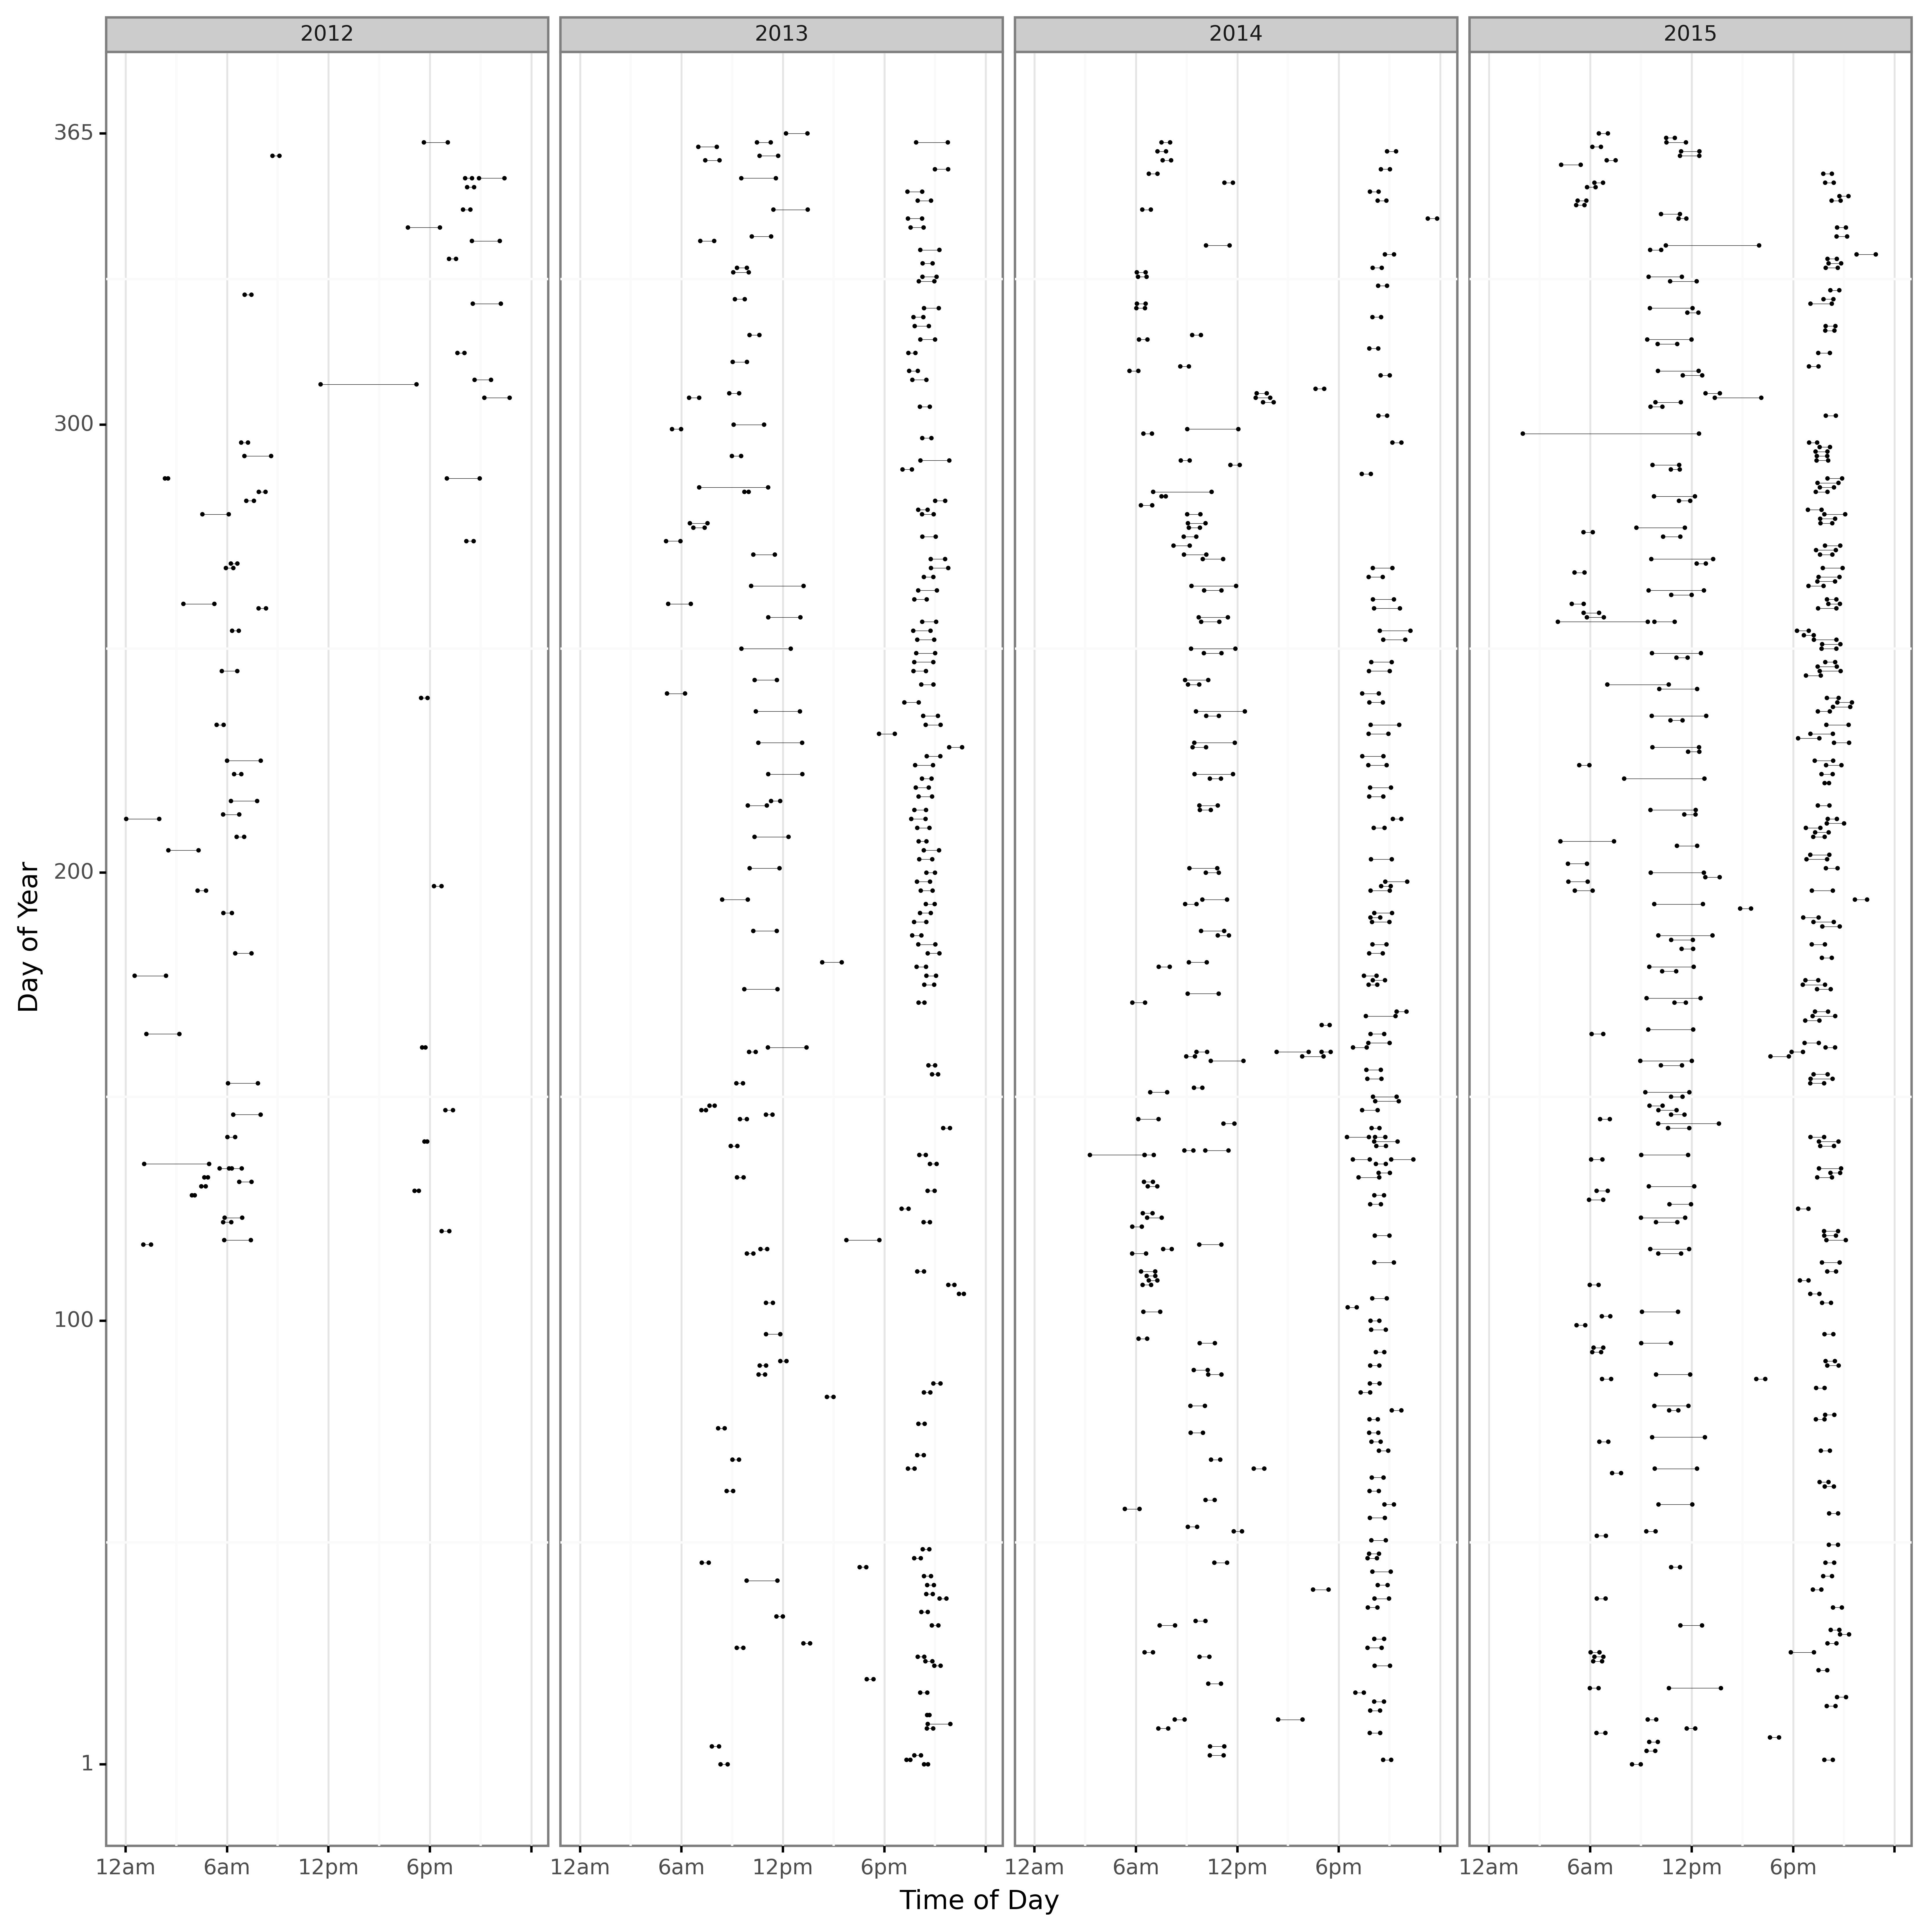
Activities shown as horizontal lines by time of day and day of year, facetted by year. Requires "activities.csv" from the bulk Strava export.
The process for downloading data is described on the Strava website here: [https://support.strava.com/hc/en-us/articles/216918437-Exporting-your-Data-and-Bulk-Export#Bulk], but in essence, do the following:
- Log in to Strava
- Select "Settings" from the main drop-down menu at top right of the screen
- Select "My Account" from the navigation menu to the left of the screen.
- Under the "Download or Delete Your Account" heading, click the "Get Started" button.
- Under the "Download Request", heading, click the "Request Your Archive" button. Don't click anything else on that page, i.e. particularly not the "Request Account Deletion" button.
- Wait for an email to be sent
- Click the link in email to download zipped folder containing activities
- Unzip files
The main function for importing and processing activity files expects a path to a directory of unzipped GPX and / or FIT files. If required, the fit2gpx package provides useful tools for pre-processing bulk files exported from Strava, e.g. unzipping activity files (see Use Case 3: Strava Bulk Export Tools).
df = process_data("<path to folder with GPX and / or FIT files>")Some plots use the "activities.csv" file from the Strava bulk export zip. For those plots, create an "activities" dataframe using the following function:
activities = process_activities("<path to activities.csv file>")plot_facets(df, output_file = 'plot.png')plot_map(df, lon_min=None, lon_max= None, lat_min=None, lat_max=None,
alpha=0.3, linewidth=0.3, output_file="map.png")plot_elevations(df, output_file = 'elevations.png')plot_landscape(df, output_file = 'landscape.png')plot_calendar(activities, year_min=2015, year_max=2017, max_dist=50,
fig_height=9, fig_width=15, output_file="calendar.png")plot_dumbbell(activities, year_min=2012, year_max=2015, local_timezone='Australia/Melbourne',
fig_height=34, fig_width=34, output_file="dumbbell.png")
