![]()
View live predictions displayed in simple web application here.


Table of Contents
- Aims and Objectives
- Dataset
- Data Cleaning and Preparation
- Feature Engineering and Data Visualisation
- Model Selection and Training
- Evaluation
- Further Work and Improvements
Aims and Objectives
The aim of this study was to build a model that could accurately predict the outcome of future premier league football matches. Success was judged using the following two objectives, one quantitative and one qualitative:
- Achieve a test accuracy of greater than 50%, with a stretch target of 60%.
- Output probabilities that appear sensible/realistic, that are comparable to odds offered on popular betting websites.
Dataset
The data was collected directly from an API: api-football. This was preferred over a static database that can be readily found online, due to the following:
- API calls can be made daily, refreshing the database with the most recent statistics and results, allowing the model to consistently be retrained on up-to-date information.
- The API not only provides past game data but also information on upcoming games, essential to make predictions which feed into the web application.
Data Cleaning and Preparation
Data was initially collected from the 2019-2020 premier league season, in the form of a single json file per fixture containing a range of stats (e.g. number of shots, possession etc.) These json files were loaded into a Pandas DataFrame, and organised into a nested dictionary in the following form: {team ID: {fixture_id: stats_df}}
Execution of 01_api_data_request.py and 02_cleaning_stats_data.py will update the database with recently played fixtures not already stored within the database and add these DataFrames directly to the nested dictionary described above.
Feature Engineering and Data Visualisation
In order to utilise as much previous match data as possible, whilst minimising the number of features, match data was averaged over the previous 10 games to predict an upcoming fixture. To understand how well a single team is performing, their average stats were subtracted from their opponent’s average stats, to produce a difference metric e.g. number of shots difference. A team with number_of_shots_diff = 2 has taken on average 2 more shots than their opponent in the previous 10 games. Seven 'difference' features were chosen:
- Goal Difference
- Shot Difference
- Shots Inside The Box Difference
- Possession Difference
- Pass Accuracy Difference
- Corners Difference
- Fouls Difference
The above describes the features for a single team, hence the number of features is doubled to 14 when predicting the outcome of a match. Like-for-like features were visualised in figure 1, and demonstrate that the chosen features have some influence on the outcome of a match, with the exception of number of fouls, which appears to have little correlation with the target result.
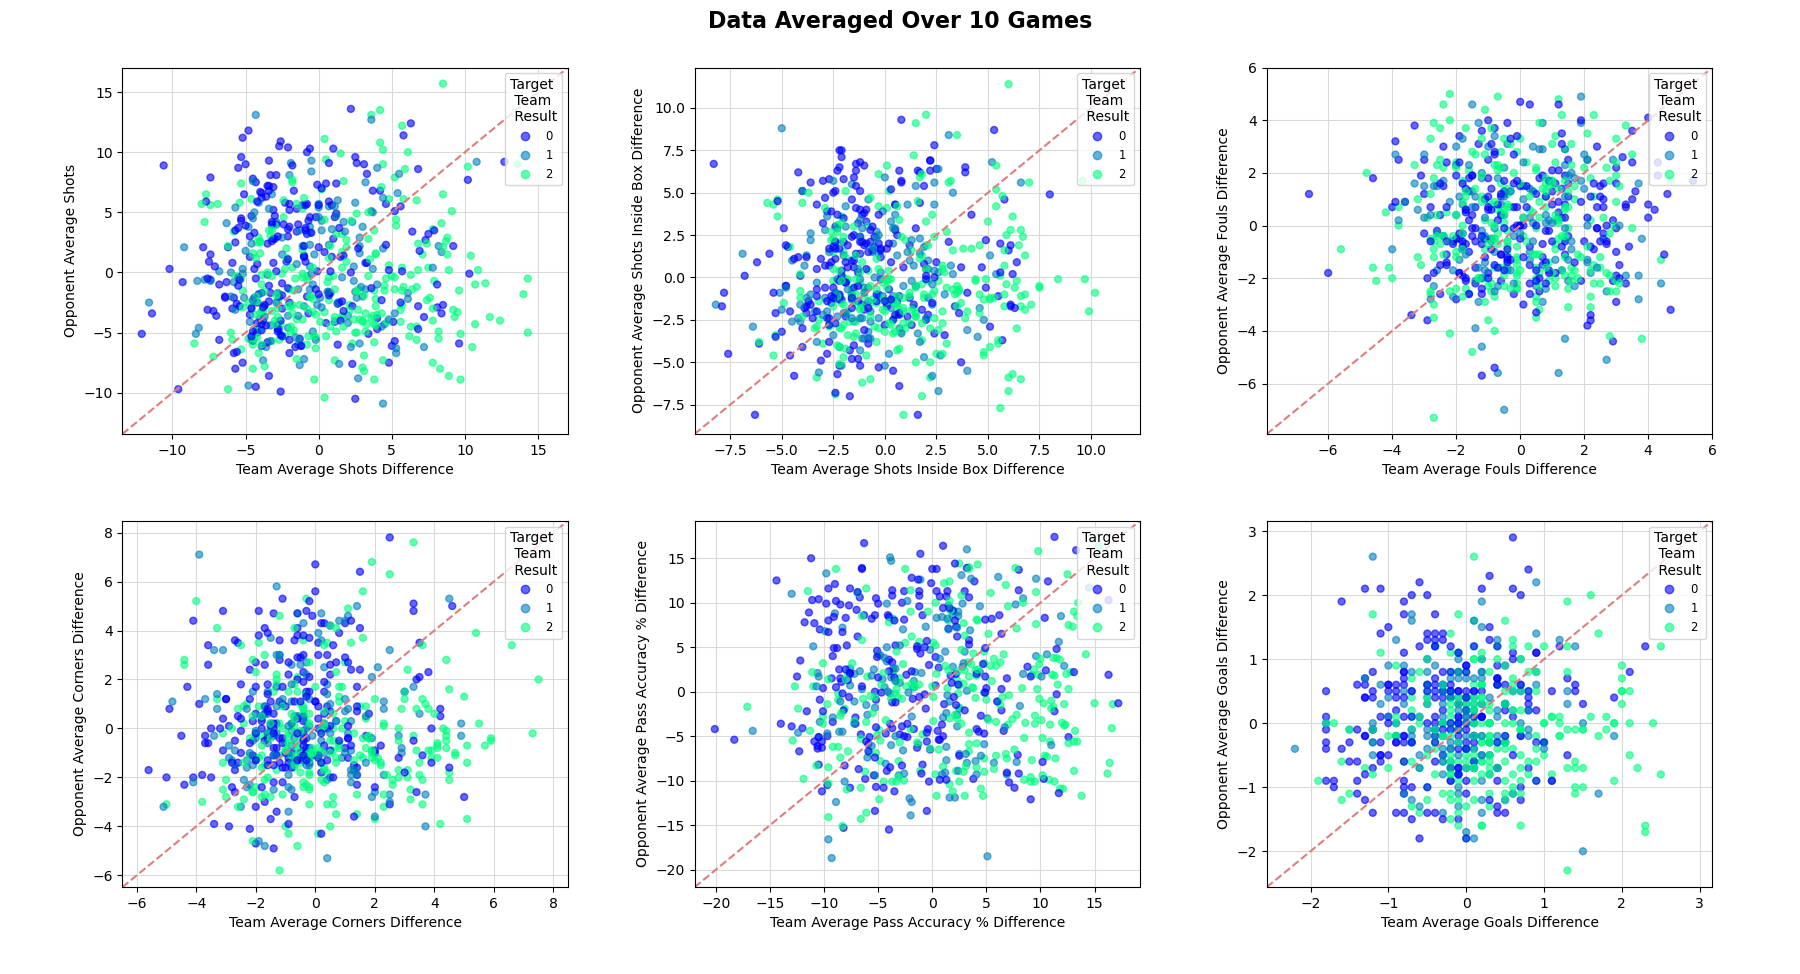
Figure 1. Green dots indicate a 'team' win and blue dots indicate an opponent win. Dots in the bottom left quadrant indicate a poor quality team and opponent, top left: low quality team and high quality opponent, top right: high quality team and opponent, bottom right: high quality team and low quality opponent.
Model Selection and Training
A range of algorithms were selected and tested from the library: scikit-learn. All models were optimised using a grid search with a 5-fold cross-validation accuracy metric. The top 3 performing algorithms explored in this report are:
- Decision Trees
- Support Vector Machine
- K-Nearest Neighbour
Evaluation
Along with accuracy, confusion matrices plotting the results of 5-fold cross-validation were initially used to evaluate model performance, displayed in figure 2 below.
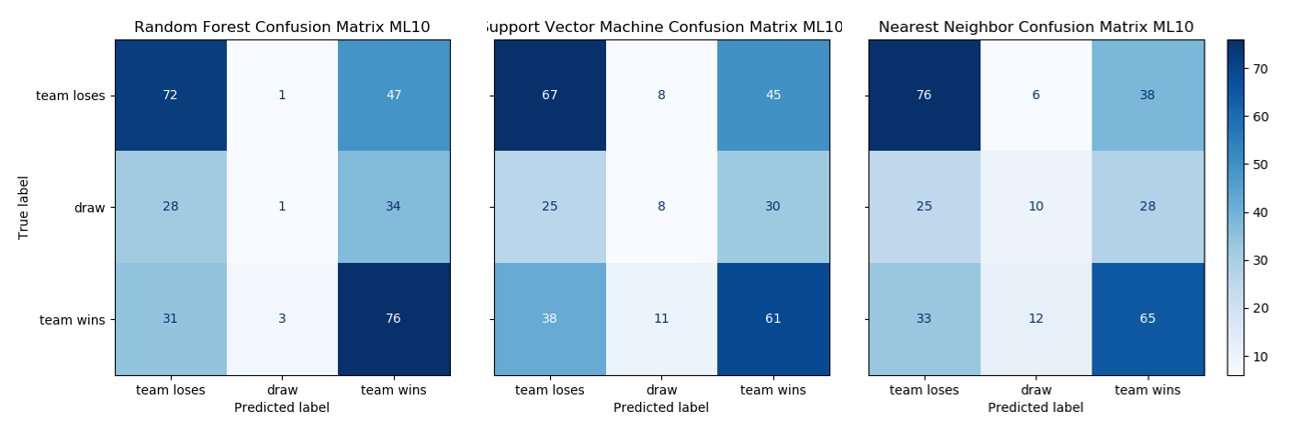
Figure 2. (a) Confusion matrix of the random forest model - 50.8% accuracy (b) confusion matrix of the SVM model - 46.4% accuracy (c) confusion matrix of the nearest neighbour model - 51.5% accuracy
Immediate inspection of these matrices shows all three models are performing poorly when predicting a draw. Both nearest neighbour and SVM are more incorrect that correct when predicting a draw and the random forest classifier only predicts 5 draws from nearly 300 fixtures. To understand why this was occurring, the features, as displayed in figure 1 were re-plotted to display only draws. It was hypothesised that equally matched teams would draw more often and therefore data clusters were expected around the dashed red lines denoting equally matched teams. It is clear however, that in this database containing results from 2019 and 2020, the distribution of drawn matches appears somewhat randomly. Given the relative infrequency of draws (approx. 1 in 5 matches) and the random nature of the outcome in this database, it is no surprise the models do a poor job of predicting them.
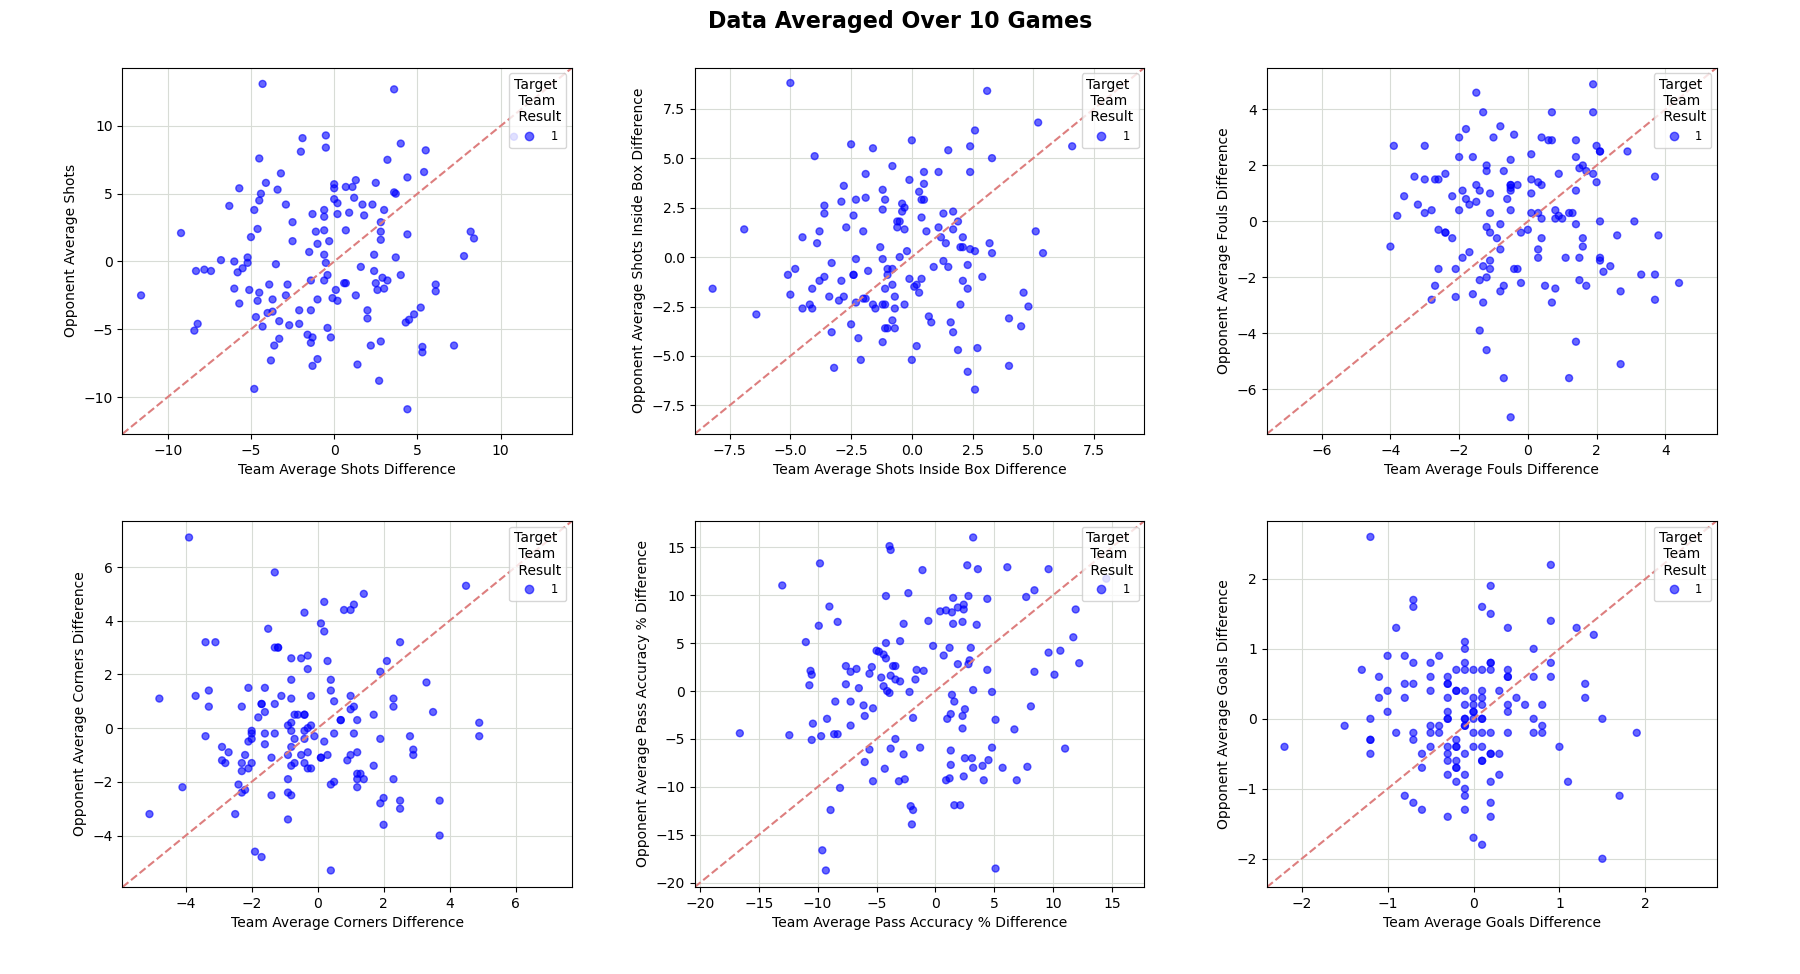
Figure 3. Cross-plotted features only where the outcome was a draw. Notice the seemingly random nature of the distribution
Both the random forest and nearest neighbour model satisfy the first aim of the study - achieve a test accuracy of 50%. As the SVM model did not satisfy this objective, the model was no longer considered for further analysis.
In order to satisfy the second objective, the model's probabilities need to be reliable. This was studied in figure 4, showing a histogram of correct and incorrect predictions given a predictions probability. A good quality model should output probabilities that are reliable and consistent with the outcome e.g. 60% probability should be correct 60% of the time. This appears to be the case with the random forest model however, the nearest neighbour model has some anomalous results. For example, predictions with a probability of 80% - 82.5% are more often incorrect than they are correct. It is for this reason; the random forest model was preferred over the nearest neighbour model.
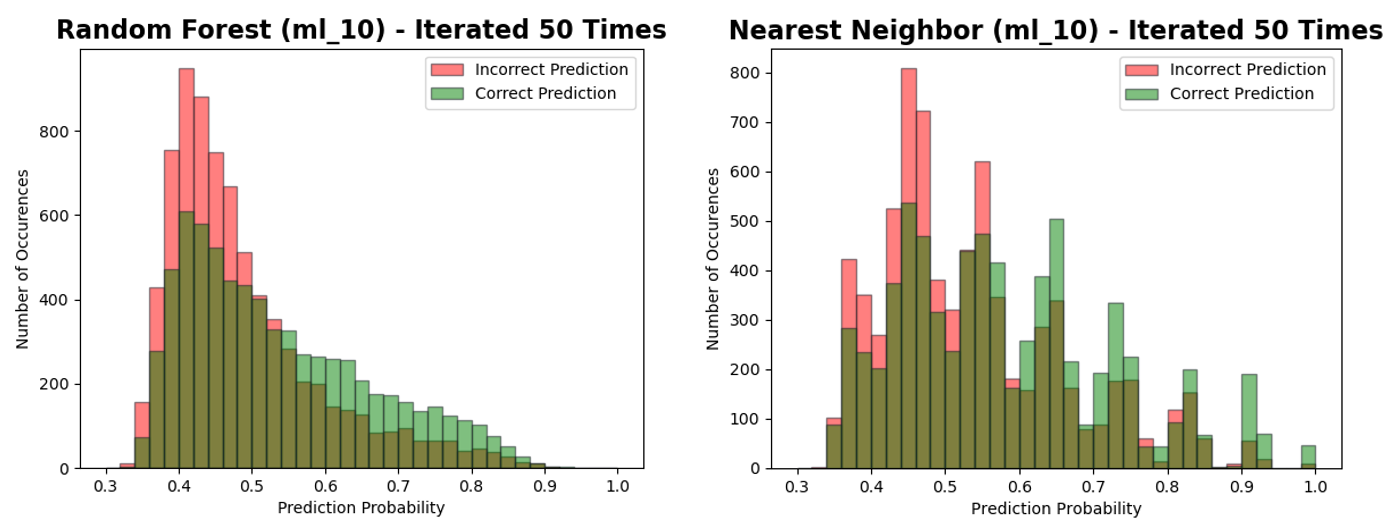
Figure 4. Histogram of both correct (green) and incorrect (red) predictions given a predictions probability (note, the colour fill is transparent to show overlap). In order to achieve a stable result, 50 iterations of model building using random train-test splits were completed.
Further Work and Improvements
Several areas of further work are suggested to improve the predictions made in this study. These include:
-
Collect additional data: api-football can supply numerous seasons of data prior to that collected in this study. It is postulated additional data collected will result in better clustering, especially those fixtures counted as a draw.
-
Incorporate additional unused stats. Stats stored within each JSON file (such as blocked shots, total number of passes etc.) were omitted to reduce feature and model complexity however, they should be incorporated into model building and compared with the performance of the existing model.
-
Currently the model is built on short term data, and specific in game statistics - like number of shots. More generic features regarding a club’s size and quality could also be added such as: average points per game, current league position, past season(s) league positions etc. This may add some context to the heavily form driven model.
-
Test alternative approaches to feature engineering. Currently, in order to reduce the number of features, game data over the past 10 fixtures are averaged. Dimensionality reduction techniques (PCA, LDA) should be tested on this raw data, with the top 20 components used for model building. These results may then be compared with the existing model.
-
Gradient boosting applied to decision trees should be tested as an additional algorithm for consideration. This approach has been cited to 'strictly outperform random forests most of the time whilst having similar properties' (Chollet, 2021).
-
Currently data engineering best practices have not been followed. All data from the API is collected and saved in a single folder location with only a single set of transformations occurring to prepare the data for ML model training. A robust medallion data lake structure should be put in place to sequentially process the data, allowing for easier access to the data for different disciplines - e.g., analytics and data science.
-
Currently data is being uploaded to this repository due to the fact I work on this project across multiple machines. Including data in the repository is not best practice and instead some file sharing mechanism should be put in place for the data.
License
This project is licensed under the MIT License. See the LICENSE file for details.