"The COVID Tracking Project collects and publishes the most complete testing data available for US states and territories. It has been cited in and used by major media companies and agencies.
![]()
Here is the demo Notebook with Covid-tracking project data
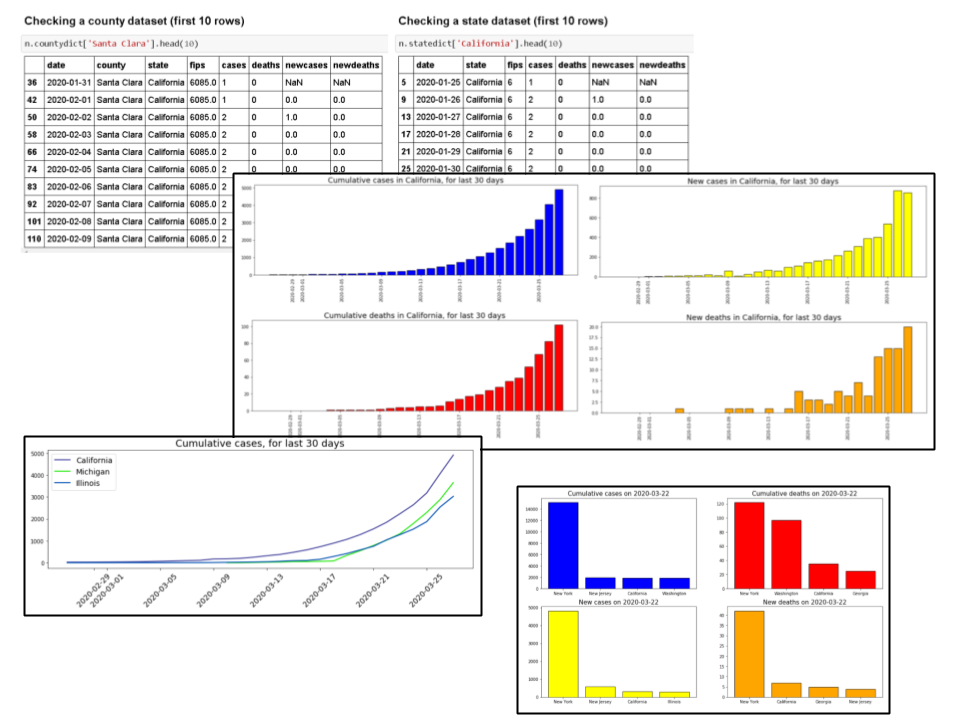
The New York Times is releasing a series of data files with cumulative counts of coronavirus cases in the United States, at the state and county level, over time. They are compiling this time series data from state and local governments and health departments in an attempt to provide a complete record of the ongoing outbreak.
Here is the NY Times Github repo: https://github.com/nytimes/covid-19-data
Here is the demo Notebook with NY Times dataset
Here is my Medium article about it: Analyze NY Times Covid-19 Dataset
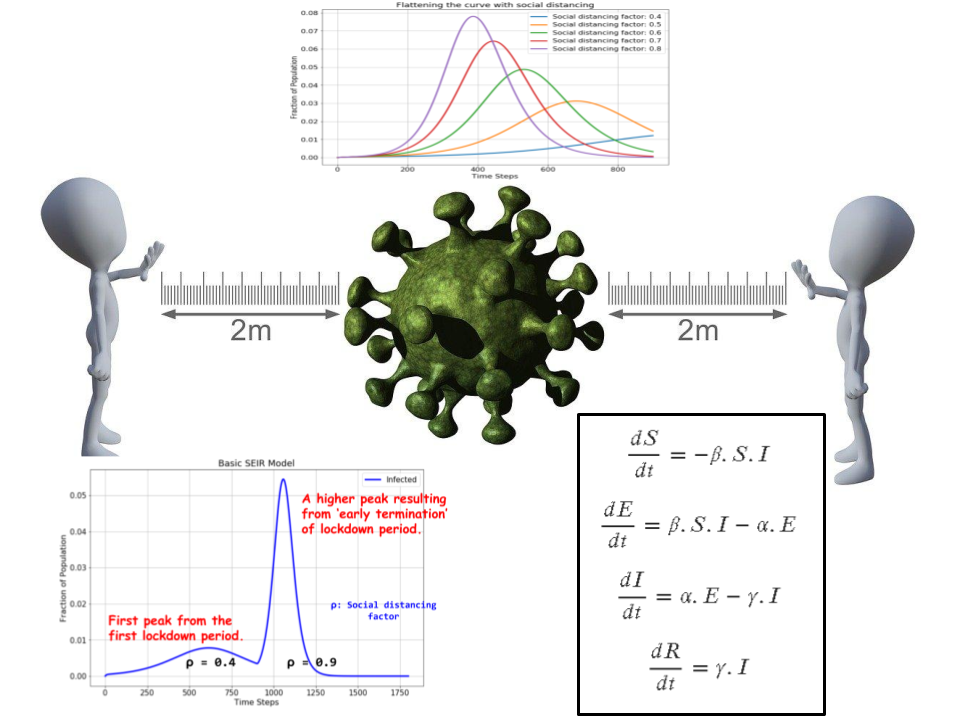
Even without venturing into actual predictive modeling, it is possible to demonstrate the efficacy of the only basic weapon that we all have against the COVID-19 virus - "social distancing" - by a simple programmatic approach.
In this demo, we will show how to build such a demo in Python, following a simple yet fundamental epidemiological theory.
Here is the demo notebook for the SEIR modeling
Here is my Medium article about it: "Simple modeling of “flattening the curve” and “lifting lockdown”