Stock Prediction
Technical and sentiment analysis to predict the stock market.
Project description
The aim of the project is to investigate the performance of various machine learning models to predict stock market movements based on historical time series data and news article sentiment collected using APIs and web scraping. The basic principle would be to buy low and sell high, but the complexity arises in knowing when to buy and sell a stock.
Four types of analysis exist to forecast the markets - fundamental, technical, quantitative and sentiment - each with its own underlying principles, tools, techniques and strategies, and it is likely that understanding the intuition of each and combining complementary approaches is more optimal than relying solely on one. Forecasting strategies will be developed based on predictions and backtested against a benchmark.
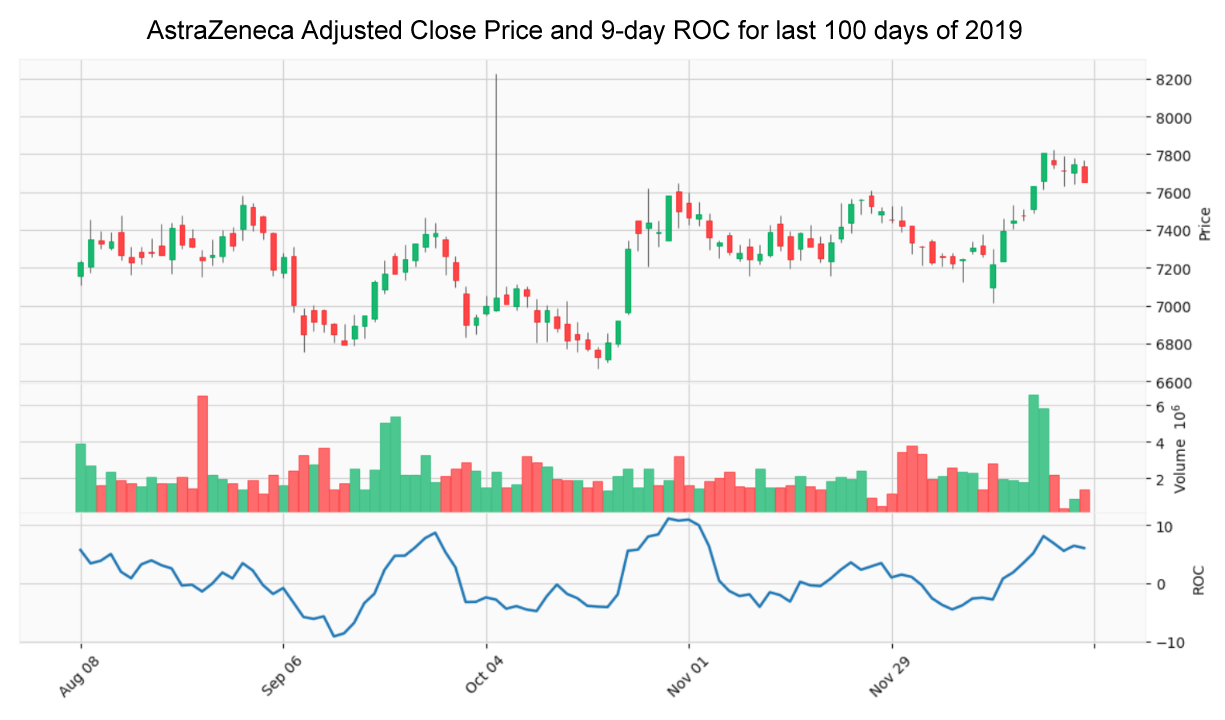
The FTSE 100 share index comprises the top 100 blue chip companies by market capitalisation listed on the London Stock Exchange, the primary stock exchange in the UK. As London’s benchmark index it is both representative of the UK’s stock market and an economic bellwether for the global economy given the international exposure of most of its constituents. This study focuses on data from six of the top FTSE 100 companies (AstraZeneca, GlaxoSmithKline, BP, Royal Dutch Shell, HSBC and Unilever) representing a range of sectors including oil, pharmaceuticals, finance and consumer.
Exploratory Data Analysis
The yfinance API will be used to download stock data for opening price (Open), highest and lowest price the stock traded at (High, Low), closing price (Close), number of stocks traded (Volume) and Adjusted Close. For the most part the Adjusted Close price will be selected for prediction purposes to take into account all corporate actions, such as stock splits and dividends, to give a more accurate reflection of the true value of the stock and present a coherent picture of returns.

Data will be transformed to calculate and visualise returns, and covariance and correlation matrices will show strength and direction of the relationship between stocks' returns. These observations could be used to select a portfolio of stocks that complement each other in terms of price movement.
Technical Analysis
Technical analysis is the use of charts and technical indicators to identify trading signals and price patterns. Various technical strategies will be investigated using the most common leading and lagging trend, momentum, volatility and volume indicators including Moving Averages, Moving Average Convergence Divergence (MACD), Stochastic Oscillator, Relative Strength Index (RSI), Money Flow Index (MFI), Rate of Change (ROC), Bollinger Bands, and On-Balance Volume (OBV).
Time Series
A time series is basically a series of data points ordered in time and is an important factor in predicting stock market trends. In time series forecasting models, time is the independent variable and the goal is to predict future values based on previously observed values.
Stock prices are often non-stationary and may contain trends or volatility but different transformations can be applied to turn the time series into a stationary process so that it can be modelled.

The Augmented Dickey-Fuller (ADF) test will be used to check for stationarity, and the order of differencing required to make the series stationary will be determined.

Autocorrelation Function (ACF) and Partial Autocorrelation Function (PACF) plots will show whether transformations have removed seasonality and any non-stationary behaviours - a necessary step before focusing on autoregressive time series models.

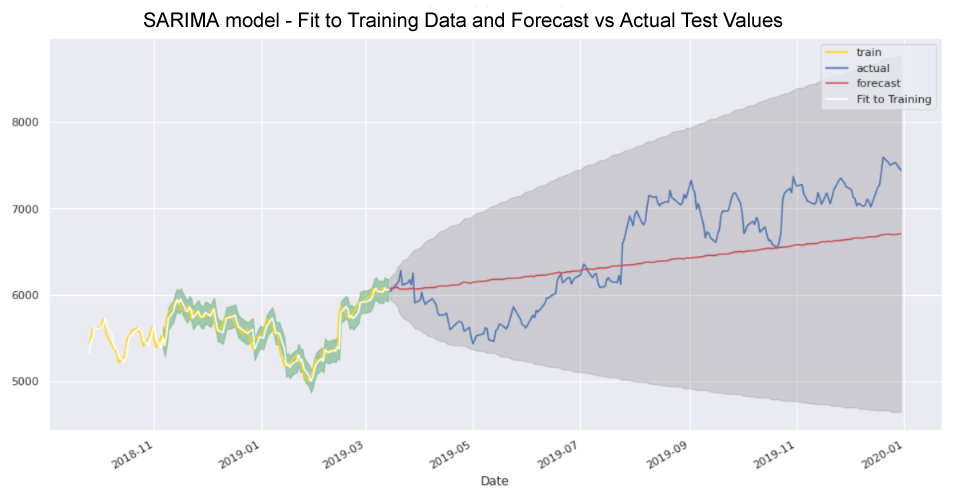
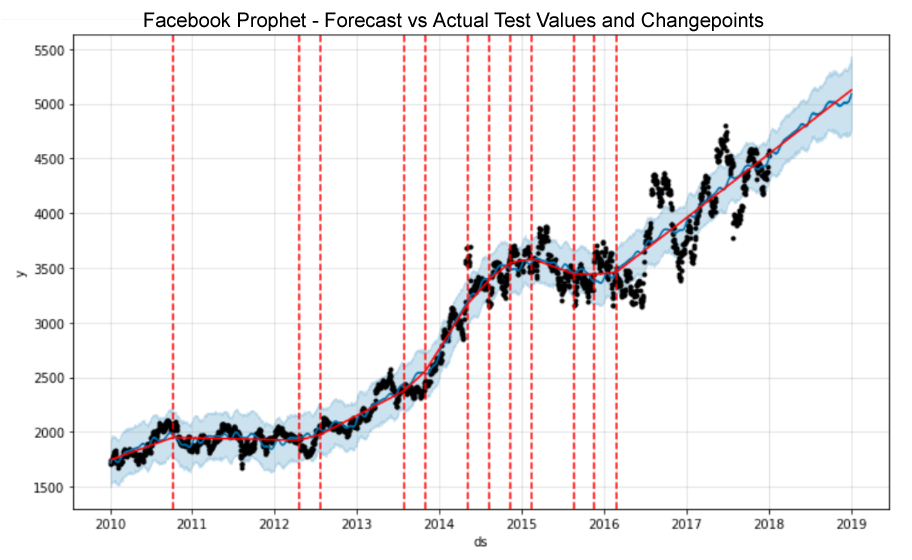
Models to be evaluated will include Moving Averages, Auto-Regressive Integrated Moving Average (ARIMA), Seasonal Auto-Regressive Integrated Moving Average (SARIMA) and Facebook Prophet.
Recurrent Neural Network (RNN) models such as Simple RNN, Long Short-Term Memory (LSTM) and Gated Recurrent Units (GRU) will also be explored and various machine learning and deep learning models created, trained, tested and optimised.

Sentiment Analysis
News articles will be collected from Investing.com by web scraping using Selenium and Beautiful Soup. Sentiment analysis will then be performed using NLP tools such as NLTK's VADER and TextBlob to find sentiment scores before combining the results with historical stock price data to determine whether news sentiment influences stock price direction.
Algorithms and techniques
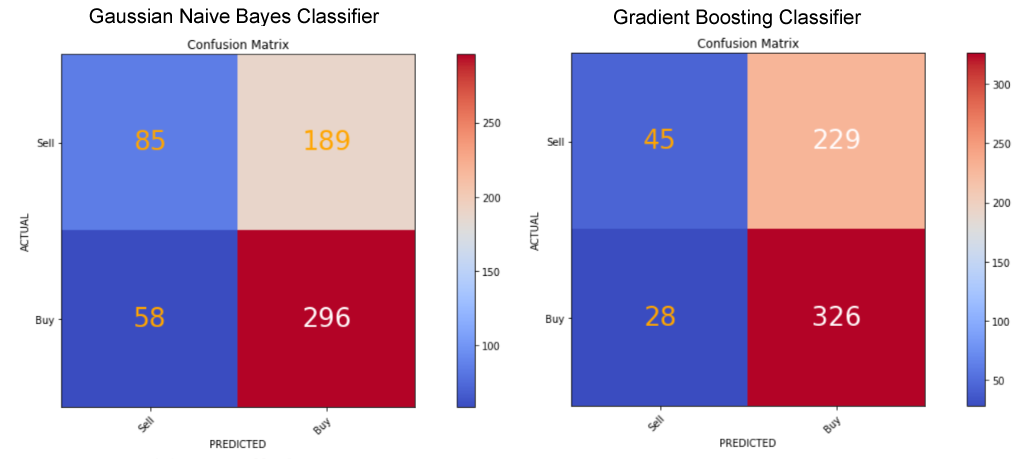
Predicting the stock market will be posed both as a regression problem of price prediction to forecast prices 'n' days in the future, and a classification problem of direction prediction to forecast whether prices will increase or decrease.
The X matrix of features will comprise any additional features engineered from the Adjusted Close price. For the regression problem, the y vector of the target variable will be the Adjusted Close price offset by however many days in advance we want to predict. For the classification problem it will be Buy and Sell signals, or 1 if the price will increase 'n' days in the future, and 0 if it will decrease, respectively.
To avoid look-ahead bias when splitting time series data into training and test sets sklearn's TimeSeriesSplit() class will be used. Successive training sets are supersets of those that come before them so that the model is not trained on data it has already seen. To use randomised data rather than walk-forward validation would lead to overfitting.
Pipelines will be built, and various Gradient-Descent based, Distance-Based and Tree-Based regression and classifier models spot checked, before selecting the best performing models for optimisation using Grid Search cross-validation, and hyperparameter tuning.
Data sources
- Yahoo! Finance for historical stock data.
- Investing.com for market news articles.
Python libraries
- Numpy
- Pandas
- Matplotlib
- Mplfinance
- Seaborn
- Plotly
- SciPy
- Statsmodels
- Scikit-learn
- Keras
- TensorFlow
- Yfinance
- Beautiful Soup
- Selenium
- NLTK
- TextBlob
- SpaCy
- Gensim
- BERT
- Hugging Face
- PyTorch


